
Bitcoin price prediction: Further downside risk ahead? BTC struggles amid sustained selling

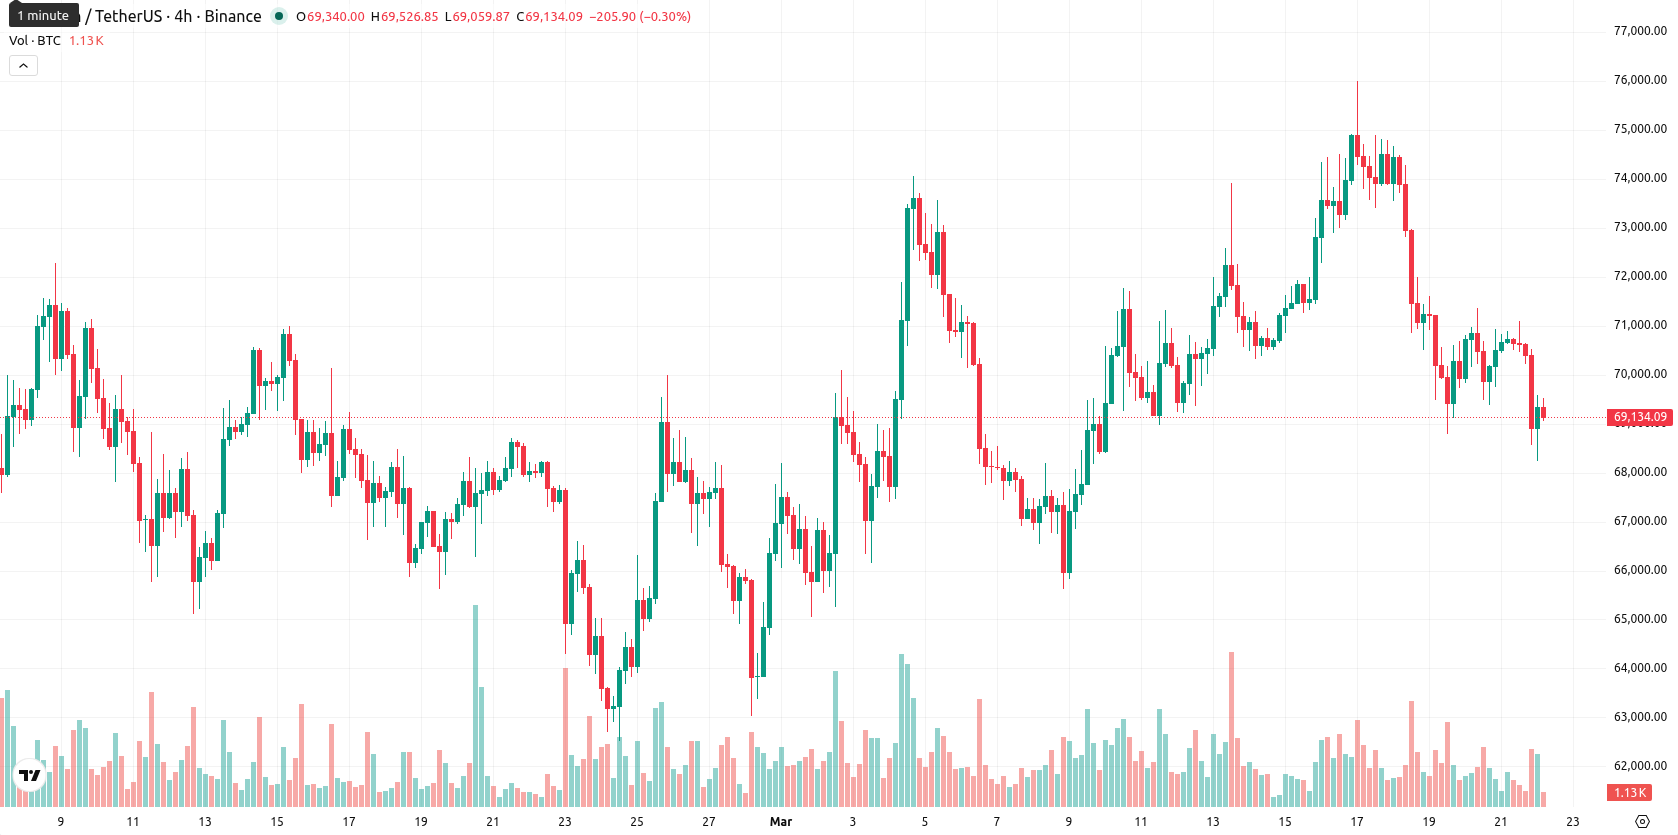
Bitcoin (BTC) is trading at $69,153.42, marking a daily decline of 2.18%. Price sits below the SMA-20 ($70,338.41), SMA-50 ($69,588.30), and well under the SMA-200 ($92,810.38), indicating ongoing seller pressure and a broadly bearish trend.
Highlights
- MicroStrategy increased its Bitcoin holdings by acquiring 89,618 BTC in Q1, reaching a total of 761,068 BTC.
- US spot Bitcoin ETFs saw $155 million in daily net inflows and a two-week total of $1.47 billion, amid continued selling pressure.
- Bitcoin is trading below key moving averages, with technical signals favoring further downside and a likely range of $67,950–$69,800 over the next week.
ETF inflows rise as institutions accumulate despite persistent selling
MicroStrategy reported the purchase of 89,618 BTC in the first quarter, increasing its total holdings to 761,068 BTC. Additionally, Morgan Stanley moved toward launching a spot Bitcoin ETF, with intentions to be the first U.S. bank offering such a product directly. Recent filings and institutional allocations in U.S. spot Bitcoin ETFs led to approximately $155 million in net inflows on March 21 and a two-week total of about $1.47 billion, though price action has remained under broader selling pressure.
Mixed momentum and resistance as technicals confirm seller dominance
Technically, BTC faces resistance at the Ichimoku Kijun ($69,255.14), just above the current price, while momentum remains divergent: D1 MACD signals buying, but both D1 and W1 ADX highlight a weak, seller-dominated trend. Daily and weekly RSI levels at 48.80 and 34.47, respectively, point to continued selling without oversold conditions, and Stoch RSI stays neutral. BBP on the daily reads overbought, but all intraday BBP points to strong selling, further confirming seller dominance in the current session.
Downward bias prevails as volatility bands define near-term risk
Over the next five trading days, BTC is expected to trade in the $67,950–$69,800 range, which defines a typical volatility band relative to current levels. Technical signals favor a continued downward bias with strong probabilities of further declines. A sideways scenario would see stabilization just above $68,000, while a break above immediate resistance ($69,255) could allow a test of $69,800. Conversely, a drop below $68,000 would likely increase downside momentum and push BTC toward new recent lows.
Earlier, analysts noted that Bitcoin's short-term price direction remains highly susceptible to external geopolitical factors and shifting liquidity conditions. The latest technical setup reinforces this sensitivity, underscoring that a sustained move above $69,255 or below $68,000 will likely determine the direction of the next significant trend.


-
 Afghanistan
-
 Albania
-
 Algeria
-
 Angola
-
 Argentina
-
 Armenia
-
 Australia
-
 Austria
-
 Azerbaijan
-
 Bahamas
-
 Bahrain
-
 Bangladesh
-
 Belarus
-
 Belgium
-
 Bolivia
-
 Botswana
-
 Brazil
-
 Brunei
-
 Bulgaria
-
 Cambodia
-
 Cameroon
-
 Canada
-
 Chile
Chile
-
 China
China
-
 Colombia
-
 Congo
Congo
-
 Costa Rica
-
 Cote d'Ivoire
-
 Croatia
-
 Cuba
Cuba
-
 Cyprus
-
 Czechia
-
 DR Congo
-
 Denmark
-
 Dominican Republic
-
 Ecuador
-
 Egypt
Egypt
-
 El Salvador
-
 Estonia
-
 Eswatini
-
 Ethiopia
-
 Finland
-
 France
-
 Georgia
-
 Germany
-
 Ghana
Ghana
-
 Greece
-
 Haiti
Haiti
-
 Hong Kong
-
 Hungary
-
 India
India
-
 Indonesia
-
 Iran, Islamic republic
-
 Iraq
Iraq
-
 Ireland
-
 Israel
-
 Italy
Italy
-
 Jamaica
-
 Japan
Japan
-
 Jordan
-
 Kazakhstan
-
 Kenya
Kenya
-
 Korea
Korea
-
 Kuwait
-
 Kyrgyzstan
-
 Laos
Laos
-
 Latvia
-
 Lebanon
-
 Lesotho
-
 Libya
Libya
-
 Lithuania
-
 Luxembourg
-
 Madagascar
-
 Malaysia
-
 Malta
Malta
-
 Mauritius
-
 Mexico
-
 Moldova
-
 Mongolia
-
 Montenegro
-
 Morocco
-
 Mozambique
-
 Myanmar
-
 Namibia
-
 Nepal
Nepal
-
 Netherlands
-
 New Zealand
-
 Nigeria
-
 North Macedonia
-
 Norway
-
 Oman
Oman
-
 Pakistan
-
 Palestine
-
 Panama
-
 Papua New Guinea
-
 Paraguay
-
 Peru
Peru
-
 Philippines
-
 Poland
-
 Portugal
-
 Puerto Rico
-
 Qatar
Qatar
-
 Reunion
-
 Romania
-
 Rwanda
-
 Saudi Arabia
-
 Serbia
-
 Singapore
-
 Slovakia
-
 Slovenia
-
 Somalia
-
 South Africa
-
 Spain
Spain
-
 Sri Lanka
-
 Sweden
-
 Switzerland
-
 Syria
Syria
-
 Taiwan
-
 Tajikistan
-
 Tanzania
-
 Thailand
-
 Trinidad and Tobago
-
 Tunisia
-
 Turkey
-
 UAE
UAE
-
 Uganda
-
 Ukraine
-
 United Kingdom
-
United States
-
 Uruguay
-
 Uzbekistan
-
 Venezuela
-
 Vietnam
-
 Yemen
Yemen
-
 Zambia
-
 Zimbabwe
- Forex
- Crypto
