
Bitcoin resistance test at $72,173: Breakout levels to watch

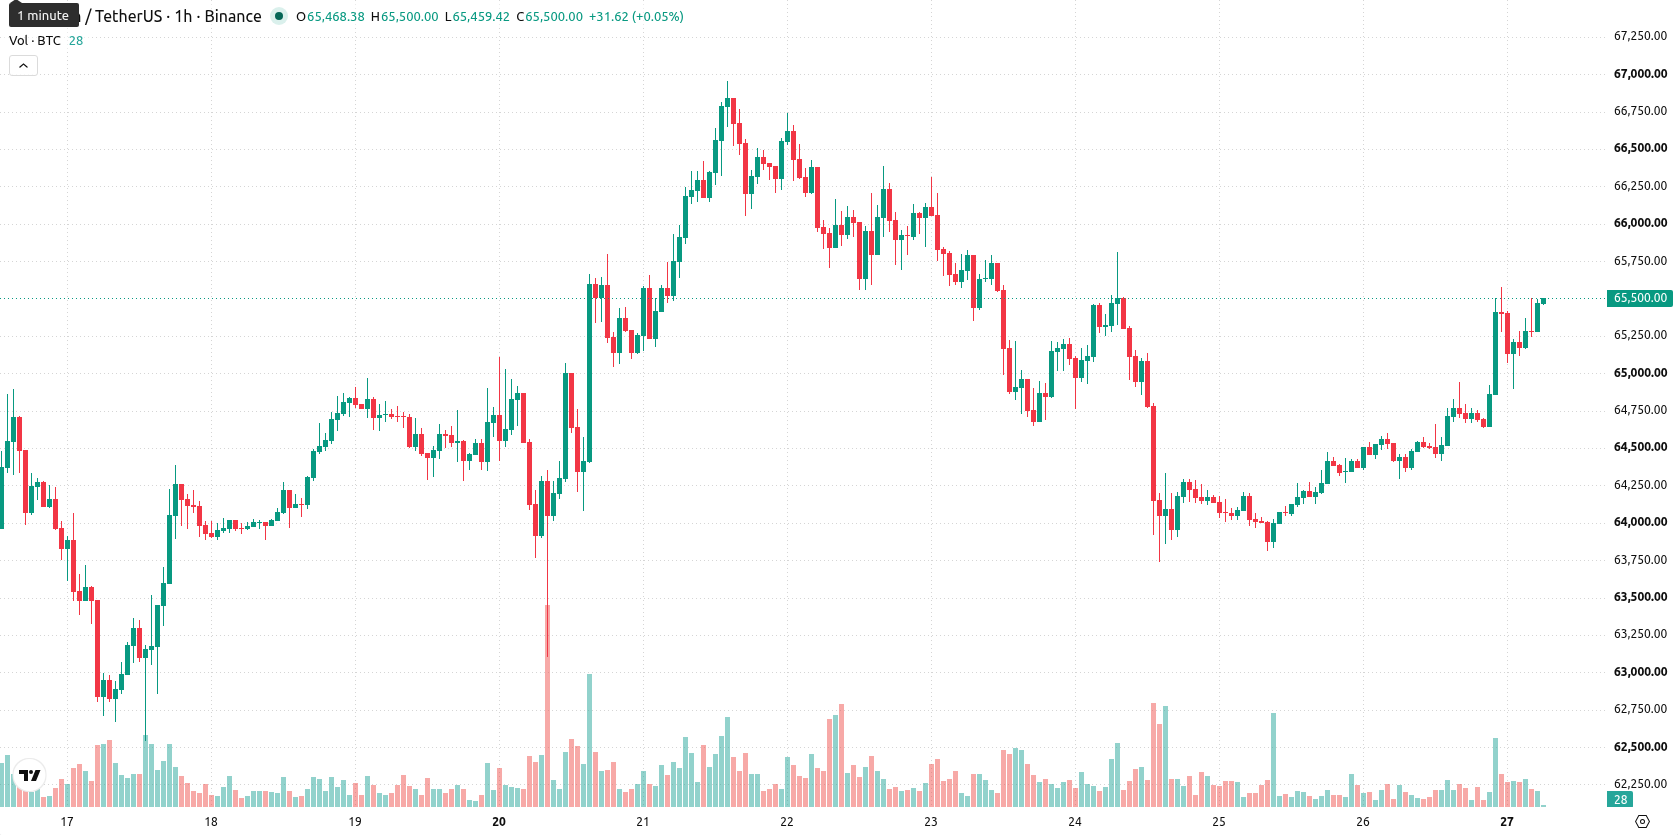
Bitcoin (BTC) is trading at $65,468, up 1.63% on the day and hovering near session highs. The crypto asset is currently positioned above its short- and medium-term moving averages, reflecting a shift in recent momentum, although it remains constrained below longer-term trend levels.
 65744.6
66956.15
65744.6
66956.15
Highlights
- Institutional inflows into U.S. spot Bitcoin ETFs drove strong demand in July before notable outflows triggered fresh volatility.
- Persistent regulatory uncertainty and institutional selling have led to increased caution and risk-off sentiment among market participants.
- BTC/USD shows short-term bullish momentum, but overbought signals suggest likely sideways consolidation between $64,749 and $67,446.
Institutional flows and regulatory uncertainty heighten volatility risk
Renewed institutional inflows into U.S. spot Bitcoin ETFs during July have channeled significant new demand into the asset class, according to Interactivecrypto, helping to underpin improved sentiment among investors. However, as Bloomberg reported, the trend was interrupted by heavy ETF outflows on July 23 and July 24, which ended a seven-session inflow streak and contributed to notable market volatility. According to Finance Biggo, the combination of institutional selling and regulatory uncertainty surrounding the U.S. CLARITY Act has led to heightened caution and periodic risk-off moves. Looking ahead, Interactivecrypto notes that market participants are closely watching the Federal Reserve’s upcoming July 28–29 meeting and related regulatory developments as potential catalysts for further action.
Upside momentum prevails as overbought signals limit conviction
BTC/USD trades above its MA-20 and MA-50 on the hourly chart, with the longer-term MA-200 situated higher at $72,173, marking a key resistance boundary. The Ichimoku Kijun at $64,935 serves as immediate support. Momentum indicators such as MACD and ADX point to robust upside activity, while RSI, Stoch RSI, and CCI reflect overbought conditions. Bull/Bear Power confirms strong intraday buyer momentum, but the Awesome Oscillator remains neutral and does not currently reinforce directional bias.
Rangebound trading likely as volatility and risk remain contained
Over the next two to three trading days, BTC/USD is expected to trade within the $64,749 to $67,446 band, representing the anticipated volatility range for this timeframe. The baseline scenario is for consolidation inside these bounds, as short-term indicators suggest limited downside risk. A decisive break above $67,446 would open the door to a fresh bullish extension, while a sustained drop below $64,935 would indicate the start of a bearish correction.
Earlier, analysts noted that Bitcoin’s upside momentum was tempered by heavy ETF outflows and persistent regulatory concerns, leaving the asset vulnerable to swings in institutional appetite. The latest return of inflows alongside ongoing volatility suggests that traders should watch for a confirmed breakout above $67,446 as the potential trigger for renewed bullish momentum.







-
 Afghanistan
-
 Albania
-
 Algeria
-
 Angola
-
 Argentina
-
 Armenia
-
 Australia
-
 Austria
-
 Azerbaijan
-
 Bahamas
-
 Bahrain
-
 Bangladesh
-
 Belarus
-
 Belgium
-
 Bolivia
-
 Botswana
-
 Brazil
-
 Brunei
-
 Bulgaria
-
 Cambodia
-
 Cameroon
-
 Canada
-
 Chile
Chile
-
 China
China
-
 Colombia
-
 Congo
Congo
-
 Costa Rica
-
 Cote d'Ivoire
-
 Croatia
-
 Cuba
Cuba
-
 Cyprus
-
 Czechia
-
 DR Congo
-
 Denmark
-
 Dominican Republic
-
 Ecuador
-
 Egypt
Egypt
-
 El Salvador
-
 Estonia
-
 Eswatini
-
 Ethiopia
-
 Finland
-
 France
-
 Georgia
-
 Germany
-
 Ghana
Ghana
-
 Greece
-
 Haiti
Haiti
-
 Hong Kong
-
 Hungary
-
 India
India
-
 Indonesia
-
 Iran, Islamic republic
-
 Iraq
Iraq
-
 Ireland
-
 Israel
-
 Italy
Italy
-
 Jamaica
-
 Japan
Japan
-
 Jordan
-
 Kazakhstan
-
 Kenya
Kenya
-
 Korea
Korea
-
 Kuwait
-
 Kyrgyzstan
-
 Laos
Laos
-
 Latvia
-
 Lebanon
-
 Lesotho
-
 Libya
Libya
-
 Lithuania
-
 Luxembourg
-
 Madagascar
-
 Malaysia
-
 Malta
Malta
-
 Mauritius
-
 Mexico
-
 Moldova
-
 Mongolia
-
 Montenegro
-
 Morocco
-
 Mozambique
-
 Myanmar
-
 Namibia
-
 Nepal
Nepal
-
 Netherlands
-
 New Zealand
-
 Nigeria
-
 North Macedonia
-
 Norway
-
 Oman
Oman
-
 Pakistan
-
 Palestine
-
 Panama
-
 Papua New Guinea
-
 Paraguay
-
 Peru
Peru
-
 Philippines
-
 Poland
-
 Portugal
-
 Puerto Rico
-
 Qatar
Qatar
-
 Reunion
-
 Romania
-
 Rwanda
-
 Saudi Arabia
-
 Serbia
-
 Singapore
-
 Slovakia
-
 Slovenia
-
 Somalia
-
 South Africa
-
 Spain
Spain
-
 Sri Lanka
-
 Sweden
-
 Switzerland
-
 Syria
Syria
-
 Taiwan
-
 Tajikistan
-
 Tanzania
-
 Thailand
-
 Trinidad and Tobago
-
 Tunisia
-
 Turkey
-
 UAE
UAE
-
 Uganda
-
 Ukraine
-
 United Kingdom
-
United States
-
 Uruguay
-
 Uzbekistan
-
 Venezuela
-
 Vietnam
-
 Yemen
Yemen
-
 Zambia
-
 Zimbabwe
- Forex
- Crypto












