
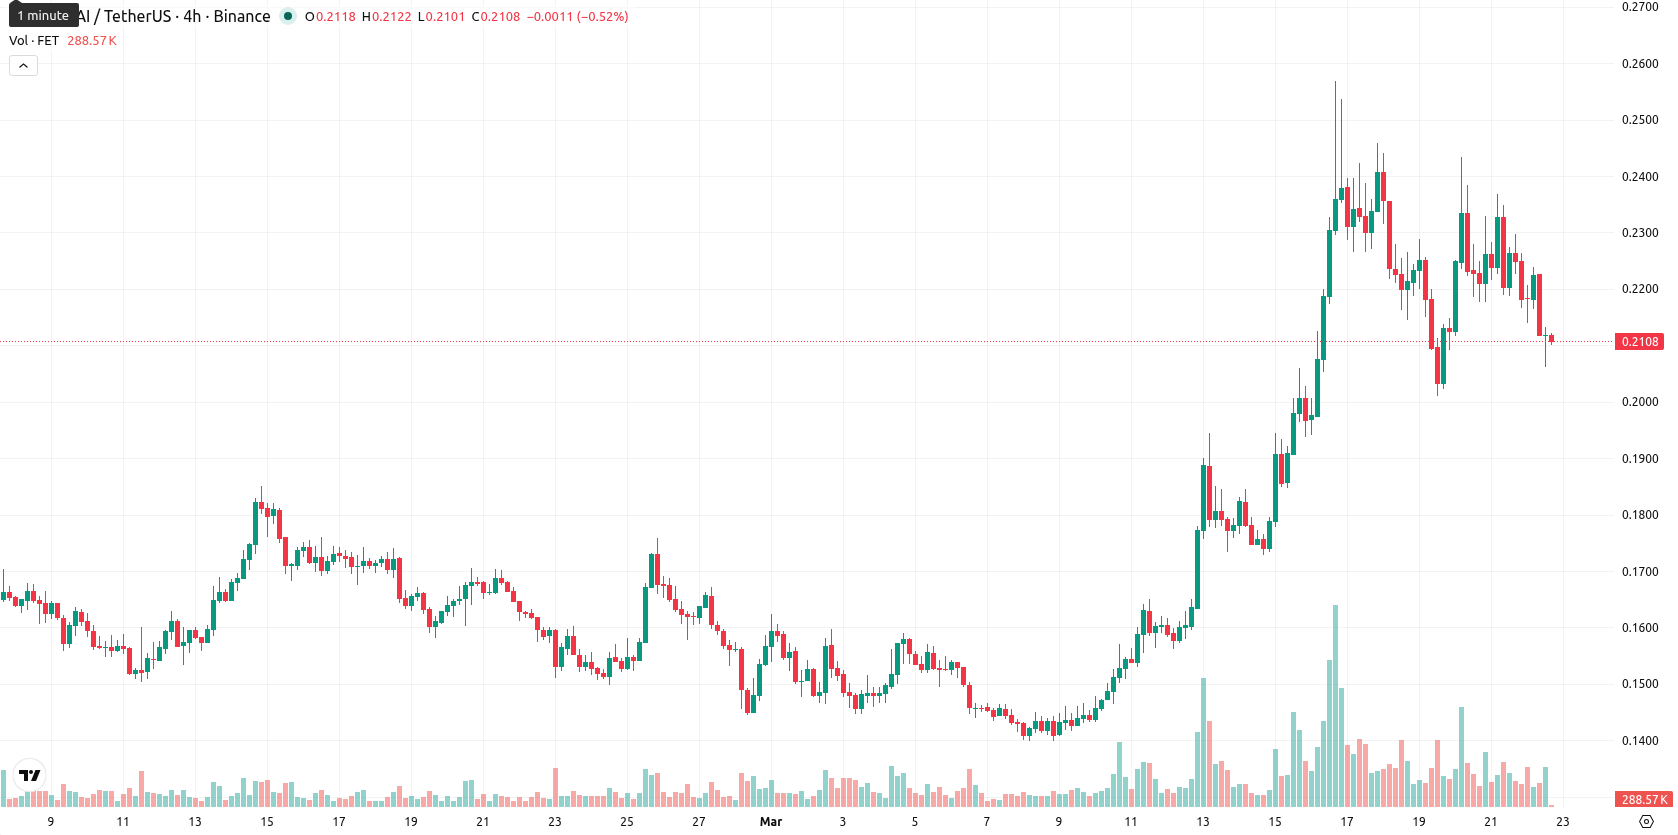
Fetch.ai falls 7.35% as technical signals point to high volatility

Fetch.ai (FET) is trading at $0.2105, down 7.35% on the day. The token remains above both the 20-day SMA ($0.1796) and 50-day SMA ($0.1713), highlighting continued short- and medium-term momentum, but is well below the 200-day SMA ($0.3024), keeping longer-term outlook cautious.
Highlights
- Fetch.ai's merger into the Artificial Superintelligence Alliance consolidated multiple decentralized AI projects into a single ecosystem in 2024.
- Trading volumes surged 20% above the monthly average, driving a volume-to-market cap ratio of 28% with capitalization now at $502 million, but price remains under selling pressure.
- Technical signals are mixed, with strong intraday selling and an 80% probability of short-term downside within a $0.2020–$0.2174 range.
Market cap steadies as merger fuels volume but selling persists
Fetch.ai's recent corporate backdrop has been shaped by the 2024 merger into the Artificial Superintelligence Alliance (ASI), which consolidated several decentralized AI projects into a unified ecosystem. Trading volumes for Fetch.ai have been reported at levels 20% above the monthly average, resulting in a volume-to-market cap ratio of 28%. The token's capitalization currently stands at $502 million, following this merger, though price action has remained under broader selling pressure.
Mixed momentum as indicators diverge near key support levels
From a technical perspective, FET is holding above its SMA-20 and SMA-50, reinforcing a constructive short- and medium-term setup; however, it remains well under the SMA-200, which signals persistent long-term bearish conditions. The Ichimoku Kijun line on the daily (D1) chart is at $0.1984, currently acting as support. Momentum indicators on D1 are mixed: MACD and ADX both show buy signals, while the RSI is biased toward overbought, CCI also reads overbought, and Stoch RSI is neutral on D1 but mixed on lower timeframes. BBP stays positive, confirming intraday buyer presence, yet the market opened lower and has trended lower throughout the session, reflecting strong volatility and diverging signals between intraday moves and broader momentum.
Downside risk elevated as weekly indicators signal persistent pressure
Over the next five trading days, FET is expected to trade within a typical volatility band of $0.2020–$0.2174. The probability of further downside is very high, with weak weekly momentum and all major weekly indicators indicating sustained pressure. The baseline scenario is a sideways range, with support at $0.2020 and resistance at $0.2174 as both bulls and bears contest short-term direction. A break above resistance could spur a short-lived rebound, while a move below support might accelerate declines.
Earlier, analysts noted that Fetch.ai exhibited short- and medium-term bullish momentum but cautioned that a sustained upside would be challenged by longer-term resistance and the potential for a near-term pullback. With current indicators showing heightened volatility, diverging signals, and increased trading activity post-merger, close attention should be paid to whether FET can maintain support above the Ichimoku Kijun line at $0.1984 as the market navigates its short-term inflection point.


-
 Afghanistan
-
 Albania
-
 Algeria
-
 Angola
-
 Argentina
-
 Armenia
-
 Australia
-
 Austria
-
 Azerbaijan
-
 Bahamas
-
 Bahrain
-
 Bangladesh
-
 Belarus
-
 Belgium
-
 Bolivia
-
 Botswana
-
 Brazil
-
 Brunei
-
 Bulgaria
-
 Cambodia
-
 Cameroon
-
 Canada
-
 Chile
Chile
-
 China
China
-
 Colombia
-
 Congo
Congo
-
 Costa Rica
-
 Cote d'Ivoire
-
 Croatia
-
 Cuba
Cuba
-
 Cyprus
-
 Czechia
-
 DR Congo
-
 Denmark
-
 Dominican Republic
-
 Ecuador
-
 Egypt
Egypt
-
 El Salvador
-
 Estonia
-
 Eswatini
-
 Ethiopia
-
 Finland
-
 France
-
 Georgia
-
 Germany
-
 Ghana
Ghana
-
 Greece
-
 Haiti
Haiti
-
 Hong Kong
-
 Hungary
-
 India
India
-
 Indonesia
-
 Iran, Islamic republic
-
 Iraq
Iraq
-
 Ireland
-
 Israel
-
 Italy
Italy
-
 Jamaica
-
 Japan
Japan
-
 Jordan
-
 Kazakhstan
-
 Kenya
Kenya
-
 Korea
Korea
-
 Kuwait
-
 Kyrgyzstan
-
 Laos
Laos
-
 Latvia
-
 Lebanon
-
 Lesotho
-
 Libya
Libya
-
 Lithuania
-
 Luxembourg
-
 Madagascar
-
 Malaysia
-
 Malta
Malta
-
 Mauritius
-
 Mexico
-
 Moldova
-
 Mongolia
-
 Montenegro
-
 Morocco
-
 Mozambique
-
 Myanmar
-
 Namibia
-
 Nepal
Nepal
-
 Netherlands
-
 New Zealand
-
 Nigeria
-
 North Macedonia
-
 Norway
-
 Oman
Oman
-
 Pakistan
-
 Palestine
-
 Panama
-
 Papua New Guinea
-
 Paraguay
-
 Peru
Peru
-
 Philippines
-
 Poland
-
 Portugal
-
 Puerto Rico
-
 Qatar
Qatar
-
 Reunion
-
 Romania
-
 Rwanda
-
 Saudi Arabia
-
 Serbia
-
 Singapore
-
 Slovakia
-
 Slovenia
-
 Somalia
-
 South Africa
-
 Spain
Spain
-
 Sri Lanka
-
 Sweden
-
 Switzerland
-
 Syria
Syria
-
 Taiwan
-
 Tajikistan
-
 Tanzania
-
 Thailand
-
 Trinidad and Tobago
-
 Tunisia
-
 Turkey
-
 UAE
UAE
-
 Uganda
-
 Ukraine
-
 United Kingdom
-
United States
-
 Uruguay
-
 Uzbekistan
-
 Venezuela
-
 Vietnam
-
 Yemen
Yemen
-
 Zambia
-
 Zimbabwe
- Forex
- Crypto
