
-7.96% for Fetch.ai as short-term support faces volatility risk

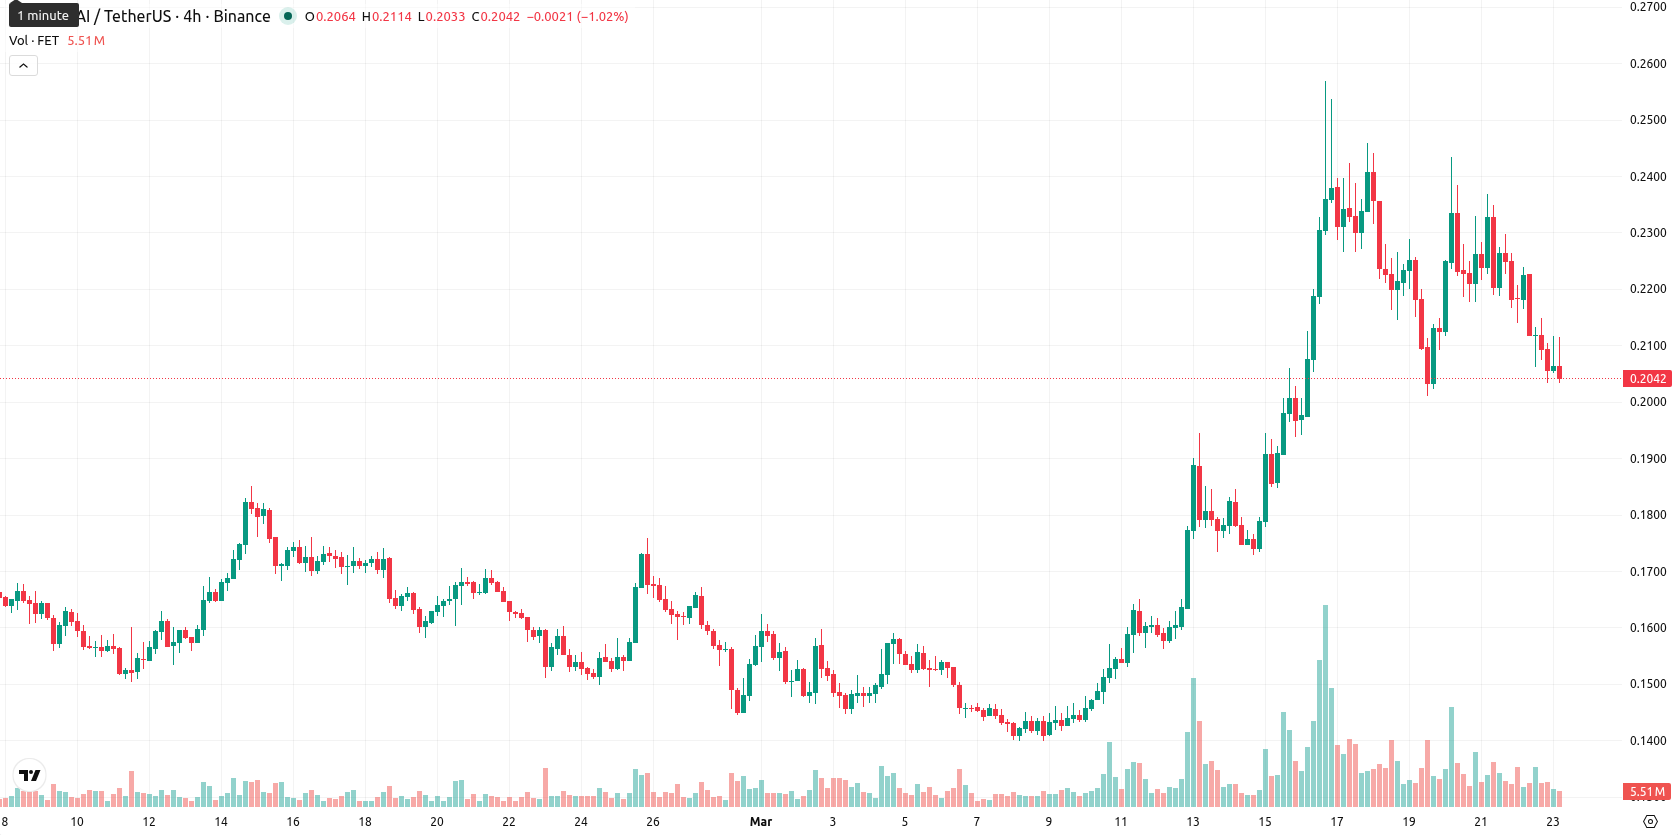
Fetch.ai (FET) is trading at $0.2036, down 7.96% on the day. The price remains well above the SMA-20 ($0.1821) and SMA-50 ($0.1715), while staying below the longer-term SMA-200 resistance at $0.3003.
Highlights
- Fetch.ai (FET) faces increased selling pressure after a 7.96% drop, trading near daily lows and showing high volatility.
- Mixed momentum signals and divergent intraday indicators reflect weak conviction, despite some underlying bullish trends on longer timeframes.
- FET is expected to oscillate between $0.1910 and $0.2100 for the next week, with downside risk prevailing unless $0.2100 is breached.
Momentum remains bullish as technical signals diverge across timeframes
FET trades above short-term moving averages (SMA-20 at $0.1821 and SMA-50 at $0.1715), but is capped by the SMA-200 at $0.3003. The Ichimoku Kijun at $0.1984 offers immediate technical support. MACD and ADX on the daily chart indicate bullish momentum, though intraday signals like RSI, Stoch RSI, and Awesome Oscillator suggest either neutral or weakening trend, while BBP shows slight buyer dominance.
Sideways bias favored as breakout odds remain subdued
For the next five sessions, volatility is expected in a typical band from $0.1910 to $0.2100. The probability of a further rise is low (under 20%), making a sideways or lower move more likely. Baseline expectation is range trading between $0.1910 and $0.2100; a move above $0.2100 could trigger a short squeeze toward $0.2150, while a loss of $0.1910 would open the way to support at $0.1850 – $0.1870.
Earlier, analysts noted that Fetch.ai exhibited short- and medium-term bullish momentum but faced persistent longer-term resistance and heightened volatility. The current setup continues to reflect this mixed outlook, with sideways or lower movement favored and traders advised to monitor the $0.1910 support as a key inflection point for potential downside risk.


Latest FET News


-
 Afghanistan
-
 Albania
-
 Algeria
-
 Angola
-
 Argentina
-
 Armenia
-
 Australia
-
 Austria
-
 Azerbaijan
-
 Bahamas
-
 Bahrain
-
 Bangladesh
-
 Belarus
-
 Belgium
-
 Bolivia
-
 Botswana
-
 Brazil
-
 Brunei
-
 Bulgaria
-
 Cambodia
-
 Cameroon
-
 Canada
-
 Chile
Chile
-
 China
China
-
 Colombia
-
 Congo
Congo
-
 Costa Rica
-
 Cote d'Ivoire
-
 Croatia
-
 Cuba
Cuba
-
 Cyprus
-
 Czechia
-
 DR Congo
-
 Denmark
-
 Dominican Republic
-
 Ecuador
-
 Egypt
Egypt
-
 El Salvador
-
 Estonia
-
 Eswatini
-
 Ethiopia
-
 Finland
-
 France
-
 Georgia
-
 Germany
-
 Ghana
Ghana
-
 Greece
-
 Haiti
Haiti
-
 Hong Kong
-
 Hungary
-
 India
India
-
 Indonesia
-
 Iran, Islamic republic
-
 Iraq
Iraq
-
 Ireland
-
 Israel
-
 Italy
Italy
-
 Jamaica
-
 Japan
Japan
-
 Jordan
-
 Kazakhstan
-
 Kenya
Kenya
-
 Korea
Korea
-
 Kuwait
-
 Kyrgyzstan
-
 Laos
Laos
-
 Latvia
-
 Lebanon
-
 Lesotho
-
 Libya
Libya
-
 Lithuania
-
 Luxembourg
-
 Madagascar
-
 Malaysia
-
 Malta
Malta
-
 Mauritius
-
 Mexico
-
 Moldova
-
 Mongolia
-
 Montenegro
-
 Morocco
-
 Mozambique
-
 Myanmar
-
 Namibia
-
 Nepal
Nepal
-
 Netherlands
-
 New Zealand
-
 Nigeria
-
 North Macedonia
-
 Norway
-
 Oman
Oman
-
 Pakistan
-
 Palestine
-
 Panama
-
 Papua New Guinea
-
 Paraguay
-
 Peru
Peru
-
 Philippines
-
 Poland
-
 Portugal
-
 Puerto Rico
-
 Qatar
Qatar
-
 Reunion
-
 Romania
-
 Rwanda
-
 Saudi Arabia
-
 Serbia
-
 Singapore
-
 Slovakia
-
 Slovenia
-
 Somalia
-
 South Africa
-
 Spain
Spain
-
 Sri Lanka
-
 Sweden
-
 Switzerland
-
 Syria
Syria
-
 Taiwan
-
 Tajikistan
-
 Tanzania
-
 Thailand
-
 Trinidad and Tobago
-
 Tunisia
-
 Turkey
-
 UAE
UAE
-
 Uganda
-
 Ukraine
-
 United Kingdom
-
United States
-
 Uruguay
-
 Uzbekistan
-
 Venezuela
-
 Vietnam
-
 Yemen
Yemen
-
 Zambia
-
 Zimbabwe
- Forex
- Crypto
