
Jito price prediction: Sideways corridor likely as JTO extends run above $0.30

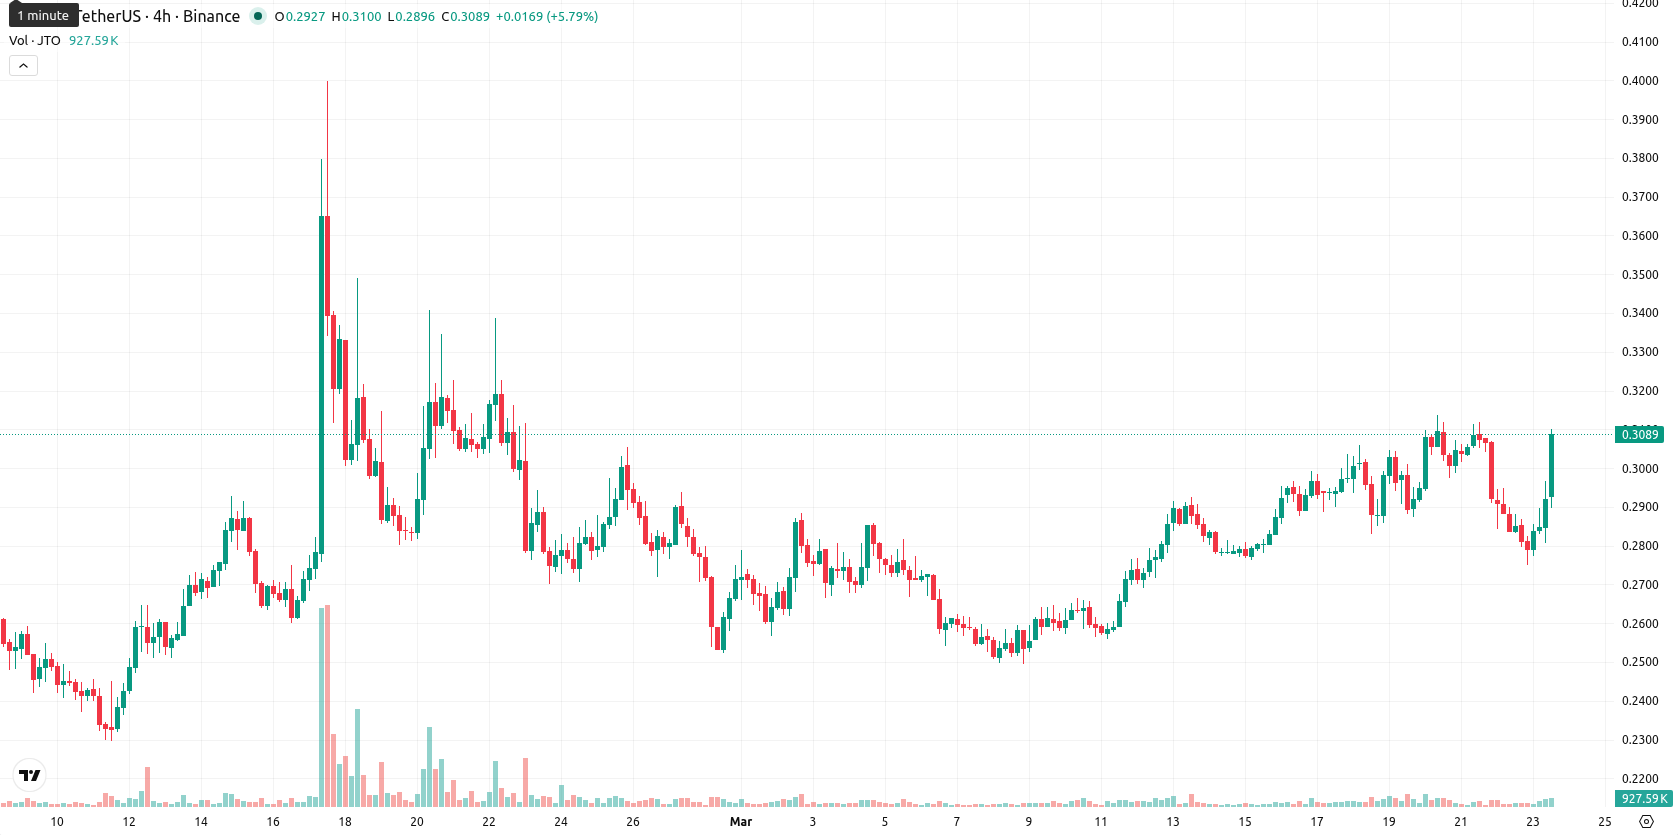
Jito (JTO) is trading at $0.3078, above the MA-20 ($0.2792) and MA-50 ($0.2783), but well below the MA-200 ($0.7238), which signals short- and medium-term bullish momentum within a broader, persistent long-term downtrend. The Ichimoku Kijun is at $0.2816, which sits below the current price and acts as immediate support.
Highlights
- JTO trades above short- and medium-term moving averages, showing short-term bullish momentum within a dominant long-term downtrend.
- Momentum and trend indicators are mixed to neutral, with intraday signals showing overbought conditions and higher volatility.
- JTO is expected to range between $0.2800 and $0.3300 over five days, with increased risk of a downside move as weekly trends remain bearish.
Divergence grows as buyers drive price near highs
Momentum signals are mixed: the daily MACD is bullish while ADX D1 is neutral, indicating a modest and unstable trend. The daily RSI is at 47.87 and trending neutral-to-weak, while the Stoch RSI and CCI D1 are both neutral, though short-horizon oscillators indicate overbought conditions. BBP is positive across intraday timeframes, confirming that buyers currently dominate momentum, and the AO is neutral at the daily scale. There was no notable gap between the previous close and today’s open, and the price trades near session highs following a strong 7.85% daily gain. Intraday volatility is high and the tone reflects persistent strength toward the highs, although overall momentum and oscillators do not fully align, highlighting some divergence between short-term buying interest and mixed longer-term signals.
Sideways trading favored as bearish weekly signals dominate
For the next five trading days, the expected price range for JTO is $0.2800 to $0.3300, with adjustments to reflect current volatility and to keep range boundaries near the observed price. The probability of further upside is very low (less than 20%), while the chance of a decline is more likely as all major weekly indicators remain bearish. Baseline scenario: the price fluctuates in a sideways corridor between $0.2800 and $0.3300. In a bullish scenario, a breakout above $0.3300 could see buyers test higher resistance zones. In a bearish turn, a drop below $0.2800 would expose the market to further pressure toward recent supports.
Earlier, analysts noted that Jito was exhibiting short- to medium-term resilience despite persistent long-term weakness. The current analysis reinforces this view, suggesting that while short-term buyers remain active, a break below $0.2800 would be a signal for renewed downside risk.


Latest Jito News


-
 Afghanistan
-
 Albania
-
 Algeria
-
 Angola
-
 Argentina
-
 Armenia
-
 Australia
-
 Austria
-
 Azerbaijan
-
 Bahamas
-
 Bahrain
-
 Bangladesh
-
 Belarus
-
 Belgium
-
 Bolivia
-
 Botswana
-
 Brazil
-
 Brunei
-
 Bulgaria
-
 Cambodia
-
 Cameroon
-
 Canada
-
 Chile
Chile
-
 China
China
-
 Colombia
-
 Congo
Congo
-
 Costa Rica
-
 Cote d'Ivoire
-
 Croatia
-
 Cuba
Cuba
-
 Cyprus
-
 Czechia
-
 DR Congo
-
 Denmark
-
 Dominican Republic
-
 Ecuador
-
 Egypt
Egypt
-
 El Salvador
-
 Estonia
-
 Eswatini
-
 Ethiopia
-
 Finland
-
 France
-
 Georgia
-
 Germany
-
 Ghana
Ghana
-
 Greece
-
 Haiti
Haiti
-
 Hong Kong
-
 Hungary
-
 India
India
-
 Indonesia
-
 Iran, Islamic republic
-
 Iraq
Iraq
-
 Ireland
-
 Israel
-
 Italy
Italy
-
 Jamaica
-
 Japan
Japan
-
 Jordan
-
 Kazakhstan
-
 Kenya
Kenya
-
 Korea
Korea
-
 Kuwait
-
 Kyrgyzstan
-
 Laos
Laos
-
 Latvia
-
 Lebanon
-
 Lesotho
-
 Libya
Libya
-
 Lithuania
-
 Luxembourg
-
 Madagascar
-
 Malaysia
-
 Malta
Malta
-
 Mauritius
-
 Mexico
-
 Moldova
-
 Mongolia
-
 Montenegro
-
 Morocco
-
 Mozambique
-
 Myanmar
-
 Namibia
-
 Nepal
Nepal
-
 Netherlands
-
 New Zealand
-
 Nigeria
-
 North Macedonia
-
 Norway
-
 Oman
Oman
-
 Pakistan
-
 Palestine
-
 Panama
-
 Papua New Guinea
-
 Paraguay
-
 Peru
Peru
-
 Philippines
-
 Poland
-
 Portugal
-
 Puerto Rico
-
 Qatar
Qatar
-
 Reunion
-
 Romania
-
 Rwanda
-
 Saudi Arabia
-
 Serbia
-
 Singapore
-
 Slovakia
-
 Slovenia
-
 Somalia
-
 South Africa
-
 Spain
Spain
-
 Sri Lanka
-
 Sweden
-
 Switzerland
-
 Syria
Syria
-
 Taiwan
-
 Tajikistan
-
 Tanzania
-
 Thailand
-
 Trinidad and Tobago
-
 Tunisia
-
 Turkey
-
 UAE
UAE
-
 Uganda
-
 Ukraine
-
 United Kingdom
-
United States
-
 Uruguay
-
 Uzbekistan
-
 Venezuela
-
 Vietnam
-
 Yemen
Yemen
-
 Zambia
-
 Zimbabwe
- Forex
- Crypto
