
+11.90% for Fetch.ai as price surges above key short-term averages

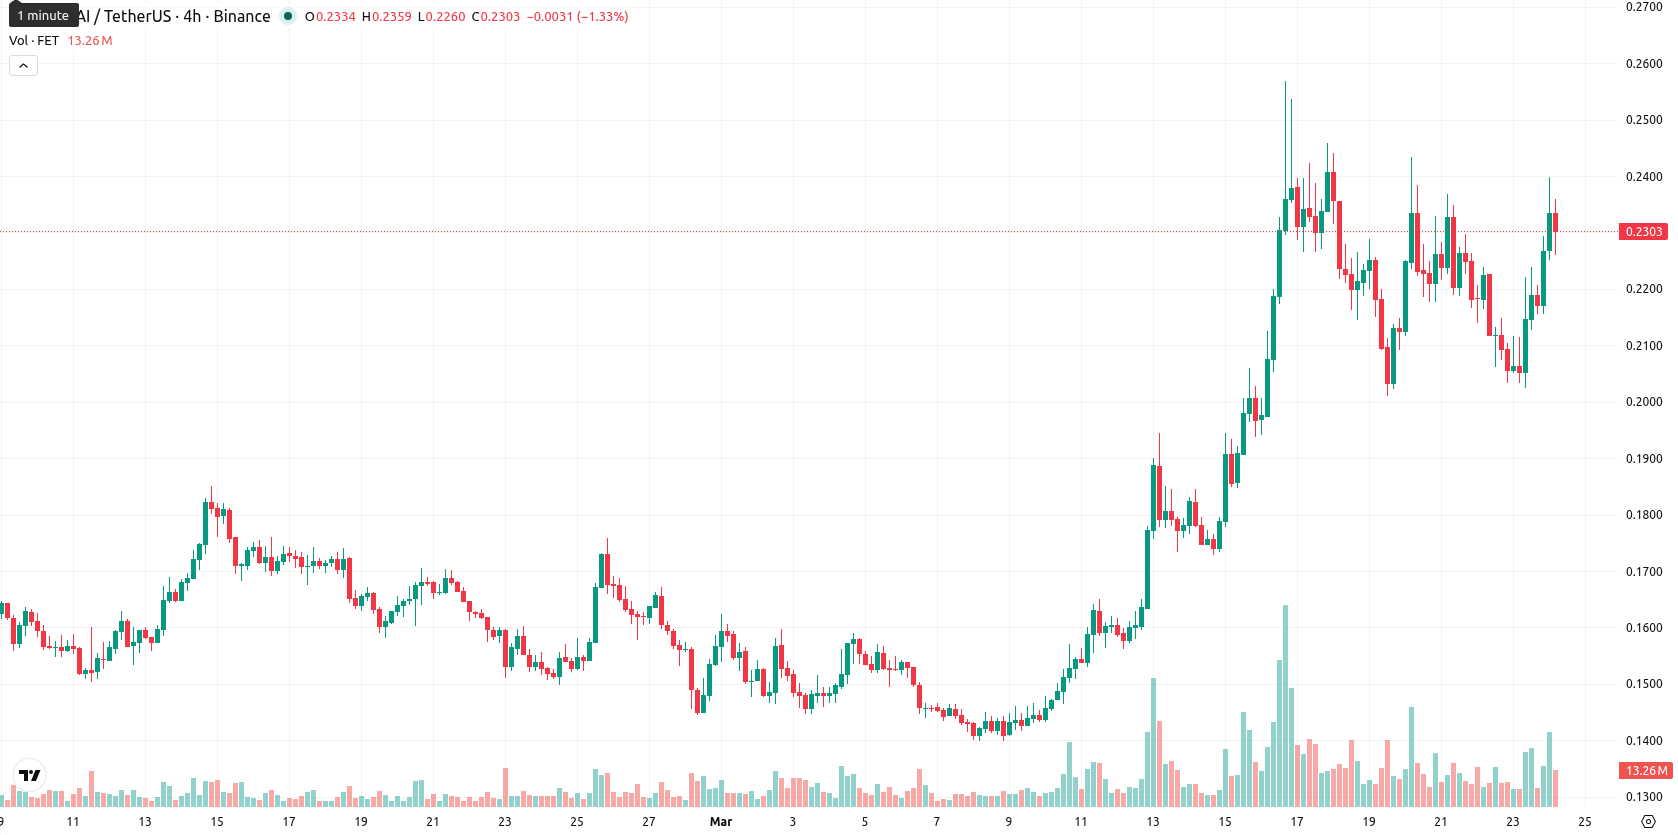
Fetch.ai (FET) is trading at $0.2295, up 11.90% on the day. The token sits well above both the SMA-20 ($0.1859) and SMA-50 ($0.1724), reflecting short- and medium-term bullish momentum, though it remains below the SMA-200 ($0.2985) which denotes longer-term resistance.
Highlights
- FET maintains short- and medium-term bullish momentum, trading above near-term moving averages but below long-term resistance.
- Momentum indicators confirm ongoing strength with a robust daily advance, yet show no clear overbought or oversold conditions.
- FET is expected to consolidate between $0.2137 and $0.2398 next week, with slight downside bias as long-term indicators remain neutral or weak.
Bullish momentum accelerates amid high volatility and indicator alignment
Momentum indicators on the daily chart are bullish: ADX signals a strong trend, MACD remains in buy territory, and BBP indicates buyer dominance, while oscillators such as RSI (62.9) and CCI (71.7) show neither overbought nor oversold conditions. The Ichimoku Kijun sits at $0.1984, serving as immediate support. FET is trading near the top of today’s intraday range ($0.2252 – $0.2398) amid high volatility and strong upside moves. All major intraday and momentum indicators confirm the bullish tone, with only sporadic short-frame divergences.
Sideways bias persists as bullish attempts face major resistance
For the coming week, FET is expected to trade within a typical volatility band of $0.2137 – $0.2398 around current levels. There is a moderate probability (20%) of further price increases, though most weekly indicators (RSI, ADX, MACD, MA-50) signal weakness or neutrality. The baseline scenario is for sideways consolidation between $0.2137 and $0.2398 as short-term buying confronts longer-term resistance. If FET breaks above $0.2398, a rapid upswing is possible, while a drop below $0.2137 may trigger renewed downside pressure.
Earlier, analysts noted that Fetch.ai was showing sustained short- and medium-term bullish momentum while still facing significant long-term resistance. The latest technical setup reinforces this outlook but adds that sideways consolidation remains the most probable scenario near current levels, making $0.2398 a key resistance to watch for any renewed trend development.


Latest FET News


-
 Afghanistan
-
 Albania
-
 Algeria
-
 Angola
-
 Argentina
-
 Armenia
-
 Australia
-
 Austria
-
 Azerbaijan
-
 Bahamas
-
 Bahrain
-
 Bangladesh
-
 Belarus
-
 Belgium
-
 Bolivia
-
 Botswana
-
 Brazil
-
 Brunei
-
 Bulgaria
-
 Cambodia
-
 Cameroon
-
 Canada
-
 Chile
Chile
-
 China
China
-
 Colombia
-
 Congo
Congo
-
 Costa Rica
-
 Cote d'Ivoire
-
 Croatia
-
 Cuba
Cuba
-
 Cyprus
-
 Czechia
-
 DR Congo
-
 Denmark
-
 Dominican Republic
-
 Ecuador
-
 Egypt
Egypt
-
 El Salvador
-
 Estonia
-
 Eswatini
-
 Ethiopia
-
 Finland
-
 France
-
 Georgia
-
 Germany
-
 Ghana
Ghana
-
 Greece
-
 Haiti
Haiti
-
 Hong Kong
-
 Hungary
-
 India
India
-
 Indonesia
-
 Iran, Islamic republic
-
 Iraq
Iraq
-
 Ireland
-
 Israel
-
 Italy
Italy
-
 Jamaica
-
 Japan
Japan
-
 Jordan
-
 Kazakhstan
-
 Kenya
Kenya
-
 Korea
Korea
-
 Kuwait
-
 Kyrgyzstan
-
 Laos
Laos
-
 Latvia
-
 Lebanon
-
 Lesotho
-
 Libya
Libya
-
 Lithuania
-
 Luxembourg
-
 Madagascar
-
 Malaysia
-
 Malta
Malta
-
 Mauritius
-
 Mexico
-
 Moldova
-
 Mongolia
-
 Montenegro
-
 Morocco
-
 Mozambique
-
 Myanmar
-
 Namibia
-
 Nepal
Nepal
-
 Netherlands
-
 New Zealand
-
 Nigeria
-
 North Macedonia
-
 Norway
-
 Oman
Oman
-
 Pakistan
-
 Palestine
-
 Panama
-
 Papua New Guinea
-
 Paraguay
-
 Peru
Peru
-
 Philippines
-
 Poland
-
 Portugal
-
 Puerto Rico
-
 Qatar
Qatar
-
 Reunion
-
 Romania
-
 Rwanda
-
 Saudi Arabia
-
 Serbia
-
 Singapore
-
 Slovakia
-
 Slovenia
-
 Somalia
-
 South Africa
-
 Spain
Spain
-
 Sri Lanka
-
 Sweden
-
 Switzerland
-
 Syria
Syria
-
 Taiwan
-
 Tajikistan
-
 Tanzania
-
 Thailand
-
 Trinidad and Tobago
-
 Tunisia
-
 Turkey
-
 UAE
UAE
-
 Uganda
-
 Ukraine
-
 United Kingdom
-
United States
-
 Uruguay
-
 Uzbekistan
-
 Venezuela
-
 Vietnam
-
 Yemen
Yemen
-
 Zambia
-
 Zimbabwe
- Forex
- Crypto
