
Gala price prediction: Near-term volatility to persist? GALA rises toward resistance

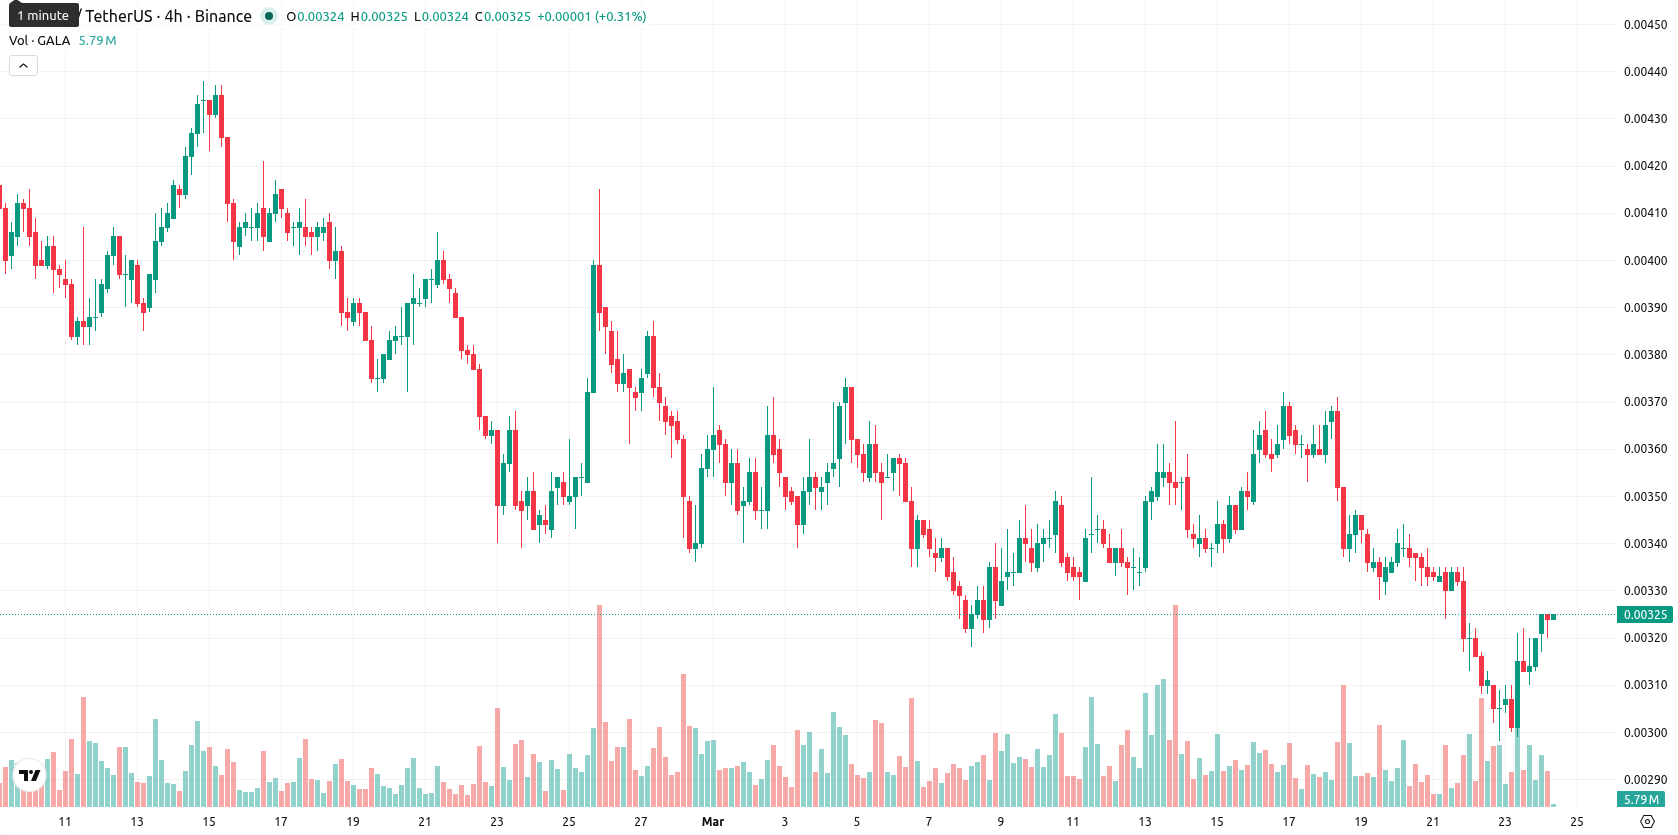
Gala (GALA) is trading at $0.00325 after daily gains of 7.62%. The asset remains below its SMA-20 ($0.00339300), SMA-50 ($0.00373540), and SMA-200 ($0.00839810) levels, maintaining a position under key moving averages and signaling sustained downside pressure.
 0.002012
0.00209700
0.002012
0.00209700
Highlights
- GALA remains under sustained downward pressure, trading below key short-, medium-, and long-term moving averages.
- Bearish momentum dominates as multiple indicators (MACD, ADX, RSI, CCI) reinforce a weak trend, though intraday volatility is moderating.
- Next week's expected range is $0.00297 to $0.00316, with upside probability low and immediate resistance at $0.00344.
Bearish momentum dominates with divergent oscillator signals
GALA's persistent trading below major moving averages, with the Ichimoku Kijun at $0.00344 as immediate resistance, highlights ongoing downside across all key horizons. Momentum indicators are mostly bearish: the D1 MACD and ADX show a weakening trend, RSI and CCI are both in oversold territory, while BBP remains negative and the Awesome Oscillator direction favors sellers. The Stoch RSI, however, gives a strong buy indication, showing some divergence among oscillators. Price action has moved closer to session highs with moderate daily volatility, but mixed momentum suggests limited support for the intraday advance.
Rangebound outlook as downside risk outweighs breakout potential
In the short term, GALA is expected to fluctuate within a volatility band between $0.00297 and $0.00316, both bounds within 10% of current levels. Persistent bearish weekly technical signals imply a low probability (under 20%) of an upward breakout, making a renewed test of support near $0.00297 more likely. The baseline scenario anticipates sideways movement in a narrow range amid continued oversold conditions. A sustained bullish reversal would require a breakout above immediate resistance at $0.00344.
Earlier, analysts noted that Gala remained entrenched in a bearish trend with limited prospects for a sustainable rebound. The current analysis reaffirms this negative outlook, with persistent technical weakness and oversold signals making any short-term recovery unlikely; traders should closely monitor for a decisive move above $0.00344 as a potential inflection point.









-
 Afghanistan
-
 Albania
-
 Algeria
-
 Angola
-
 Argentina
-
 Armenia
-
 Australia
-
 Austria
-
 Azerbaijan
-
 Bahamas
-
 Bahrain
-
 Bangladesh
-
 Belarus
-
 Belgium
-
 Bolivia
-
 Botswana
-
 Brazil
-
 Brunei
-
 Bulgaria
-
 Cambodia
-
 Cameroon
-
 Canada
-
 Chile
Chile
-
 China
China
-
 Colombia
-
 Congo
Congo
-
 Costa Rica
-
 Cote d'Ivoire
-
 Croatia
-
 Cuba
Cuba
-
 Cyprus
-
 Czechia
-
 DR Congo
-
 Denmark
-
 Dominican Republic
-
 Ecuador
-
 Egypt
Egypt
-
 El Salvador
-
 Estonia
-
 Eswatini
-
 Ethiopia
-
 Finland
-
 France
-
 Georgia
-
 Germany
-
 Ghana
Ghana
-
 Greece
-
 Haiti
Haiti
-
 Hong Kong
-
 Hungary
-
 India
India
-
 Indonesia
-
 Iran, Islamic republic
-
 Iraq
Iraq
-
 Ireland
-
 Israel
-
 Italy
Italy
-
 Jamaica
-
 Japan
Japan
-
 Jordan
-
 Kazakhstan
-
 Kenya
Kenya
-
 Korea
Korea
-
 Kuwait
-
 Kyrgyzstan
-
 Laos
Laos
-
 Latvia
-
 Lebanon
-
 Lesotho
-
 Libya
Libya
-
 Lithuania
-
 Luxembourg
-
 Madagascar
-
 Malaysia
-
 Malta
Malta
-
 Mauritius
-
 Mexico
-
 Moldova
-
 Mongolia
-
 Montenegro
-
 Morocco
-
 Mozambique
-
 Myanmar
-
 Namibia
-
 Nepal
Nepal
-
 Netherlands
-
 New Zealand
-
 Nigeria
-
 North Macedonia
-
 Norway
-
 Oman
Oman
-
 Pakistan
-
 Palestine
-
 Panama
-
 Papua New Guinea
-
 Paraguay
-
 Peru
Peru
-
 Philippines
-
 Poland
-
 Portugal
-
 Puerto Rico
-
 Qatar
Qatar
-
 Reunion
-
 Romania
-
 Rwanda
-
 Saudi Arabia
-
 Serbia
-
 Singapore
-
 Slovakia
-
 Slovenia
-
 Somalia
-
 South Africa
-
 Spain
Spain
-
 Sri Lanka
-
 Sweden
-
 Switzerland
-
 Syria
Syria
-
 Taiwan
-
 Tajikistan
-
 Tanzania
-
 Thailand
-
 Trinidad and Tobago
-
 Tunisia
-
 Turkey
-
 UAE
UAE
-
 Uganda
-
 Ukraine
-
 United Kingdom
-
United States
-
 Uruguay
-
 Uzbekistan
-
 Venezuela
-
 Vietnam
-
 Yemen
Yemen
-
 Zambia
-
 Zimbabwe
- Forex
- Crypto












