
+8.06% for Ethena as short-term buyers push against bearish backdrop

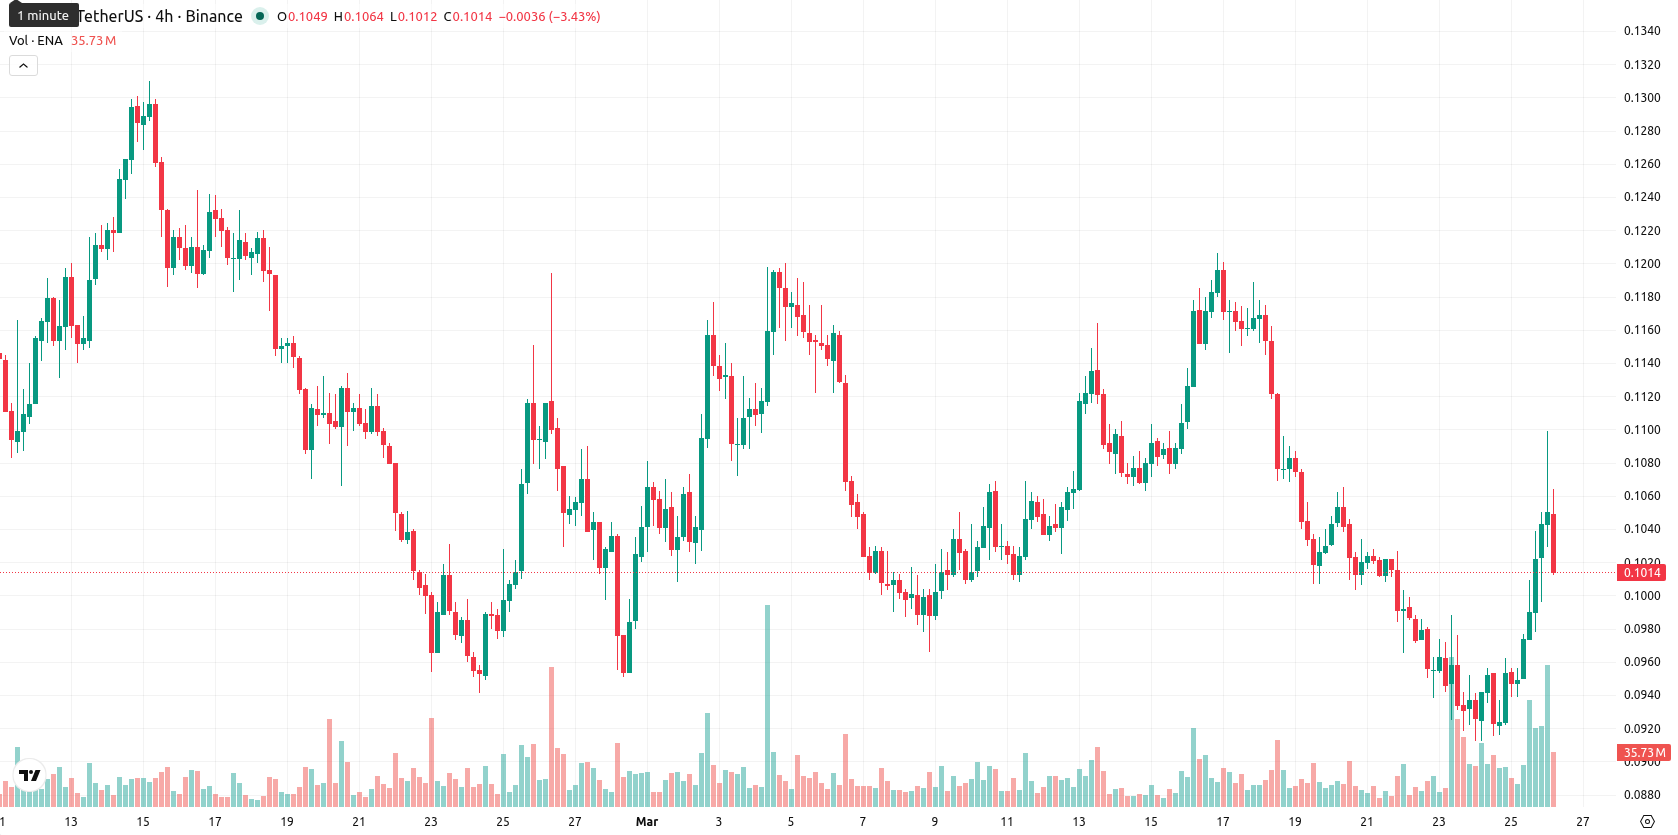
Ethena (ENA) is trading at $0.1019, which places it below the SMA-20 ($0.1042), SMA-50 ($0.1102), and SMA-200 ($0.2981), suggesting lingering medium- and long-term seller pressure despite some short-term support. The Ichimoku Kijun level at $0.1060 sits above the market, acting as immediate resistance.
Highlights
- ENA continues to face medium- and long-term selling pressure, indicated by its position below key moving averages.
- Momentum indicators are mixed, showing short-term buyer activity but overall weak and bearish signals for the broader trend.
- Expected weekly trading range is $0.0990–$0.1120, with a low probability of sustained upside and further downside risk prevailing.
Intraday gains contrast with weak momentum and volatile trading
Momentum signals are mixed: D1 MACD and ADX both point to weak momentum and ongoing bearish pressure, while RSI (47) and CCI (-50) are mildly bearish and not oversold. Stoch RSI is neutral at the daily level. BBP signals strong intraday buyer dominance even though overall momentum remains soft. AO aligns with the downside, adding further caution. Today's $0.0076 gain (up 8.06%) opened higher after a sizable gap and is currently trading near the lower half of the session range ($0.1031–$0.1099), indicating high volatility and some lingering weakness after the initial strength. Oscillators and momentum indicators diverge, with positive intraday price action not fully supported by the bigger-picture momentum outlook.
Sideways bias favored as upside faces resistance and bears dominate
For the upcoming week, the expected trading corridor is adjusted to $0.0990–$0.1120, bracketing the current price as ENA consolidates. Probability of a sustained upward move is very low (less than 20%), while a further decline is more likely based on the overwhelmingly bearish signals from W1 and D1. In the baseline scenario, ENA holds a sideways range between support and resistance. A bullish scenario would require a break above $0.1060, challenging the Ichimoku resistance and SMA-20, while the bearish scenario unfolds with a drop below short-term support, exposing further downside to the $0.0990 area.
Earlier, analysts noted that Ethena's price outlook remained bearish, weighed down by persistent selling pressure and tepid momentum despite brief intraday rallies. Current price action and indicator readings reaffirm this cautious stance, suggesting that traders should monitor the $0.1060 resistance and $0.0990 support for signs of a decisive breakout or breakdown from the prevailing consolidation phase.


Latest Ethena News


-
 Afghanistan
-
 Albania
-
 Algeria
-
 Angola
-
 Argentina
-
 Armenia
-
 Australia
-
 Austria
-
 Azerbaijan
-
 Bahamas
-
 Bahrain
-
 Bangladesh
-
 Belarus
-
 Belgium
-
 Bolivia
-
 Botswana
-
 Brazil
-
 Brunei
-
 Bulgaria
-
 Cambodia
-
 Cameroon
-
 Canada
-
 Chile
Chile
-
 China
China
-
 Colombia
-
 Congo
Congo
-
 Costa Rica
-
 Cote d'Ivoire
-
 Croatia
-
 Cuba
Cuba
-
 Cyprus
-
 Czechia
-
 DR Congo
-
 Denmark
-
 Dominican Republic
-
 Ecuador
-
 Egypt
Egypt
-
 El Salvador
-
 Estonia
-
 Eswatini
-
 Ethiopia
-
 Finland
-
 France
-
 Georgia
-
 Germany
-
 Ghana
Ghana
-
 Greece
-
 Haiti
Haiti
-
 Hong Kong
-
 Hungary
-
 India
India
-
 Indonesia
-
 Iran, Islamic republic
-
 Iraq
Iraq
-
 Ireland
-
 Israel
-
 Italy
Italy
-
 Jamaica
-
 Japan
Japan
-
 Jordan
-
 Kazakhstan
-
 Kenya
Kenya
-
 Korea
Korea
-
 Kuwait
-
 Kyrgyzstan
-
 Laos
Laos
-
 Latvia
-
 Lebanon
-
 Lesotho
-
 Libya
Libya
-
 Lithuania
-
 Luxembourg
-
 Madagascar
-
 Malaysia
-
 Malta
Malta
-
 Mauritius
-
 Mexico
-
 Moldova
-
 Mongolia
-
 Montenegro
-
 Morocco
-
 Mozambique
-
 Myanmar
-
 Namibia
-
 Nepal
Nepal
-
 Netherlands
-
 New Zealand
-
 Nigeria
-
 North Macedonia
-
 Norway
-
 Oman
Oman
-
 Pakistan
-
 Palestine
-
 Panama
-
 Papua New Guinea
-
 Paraguay
-
 Peru
Peru
-
 Philippines
-
 Poland
-
 Portugal
-
 Puerto Rico
-
 Qatar
Qatar
-
 Reunion
-
 Romania
-
 Rwanda
-
 Saudi Arabia
-
 Serbia
-
 Singapore
-
 Slovakia
-
 Slovenia
-
 Somalia
-
 South Africa
-
 Spain
Spain
-
 Sri Lanka
-
 Sweden
-
 Switzerland
-
 Syria
Syria
-
 Taiwan
-
 Tajikistan
-
 Tanzania
-
 Thailand
-
 Trinidad and Tobago
-
 Tunisia
-
 Turkey
-
 UAE
UAE
-
 Uganda
-
 Ukraine
-
 United Kingdom
-
United States
-
 Uruguay
-
 Uzbekistan
-
 Venezuela
-
 Vietnam
-
 Yemen
Yemen
-
 Zambia
-
 Zimbabwe
- Forex
- Crypto
