
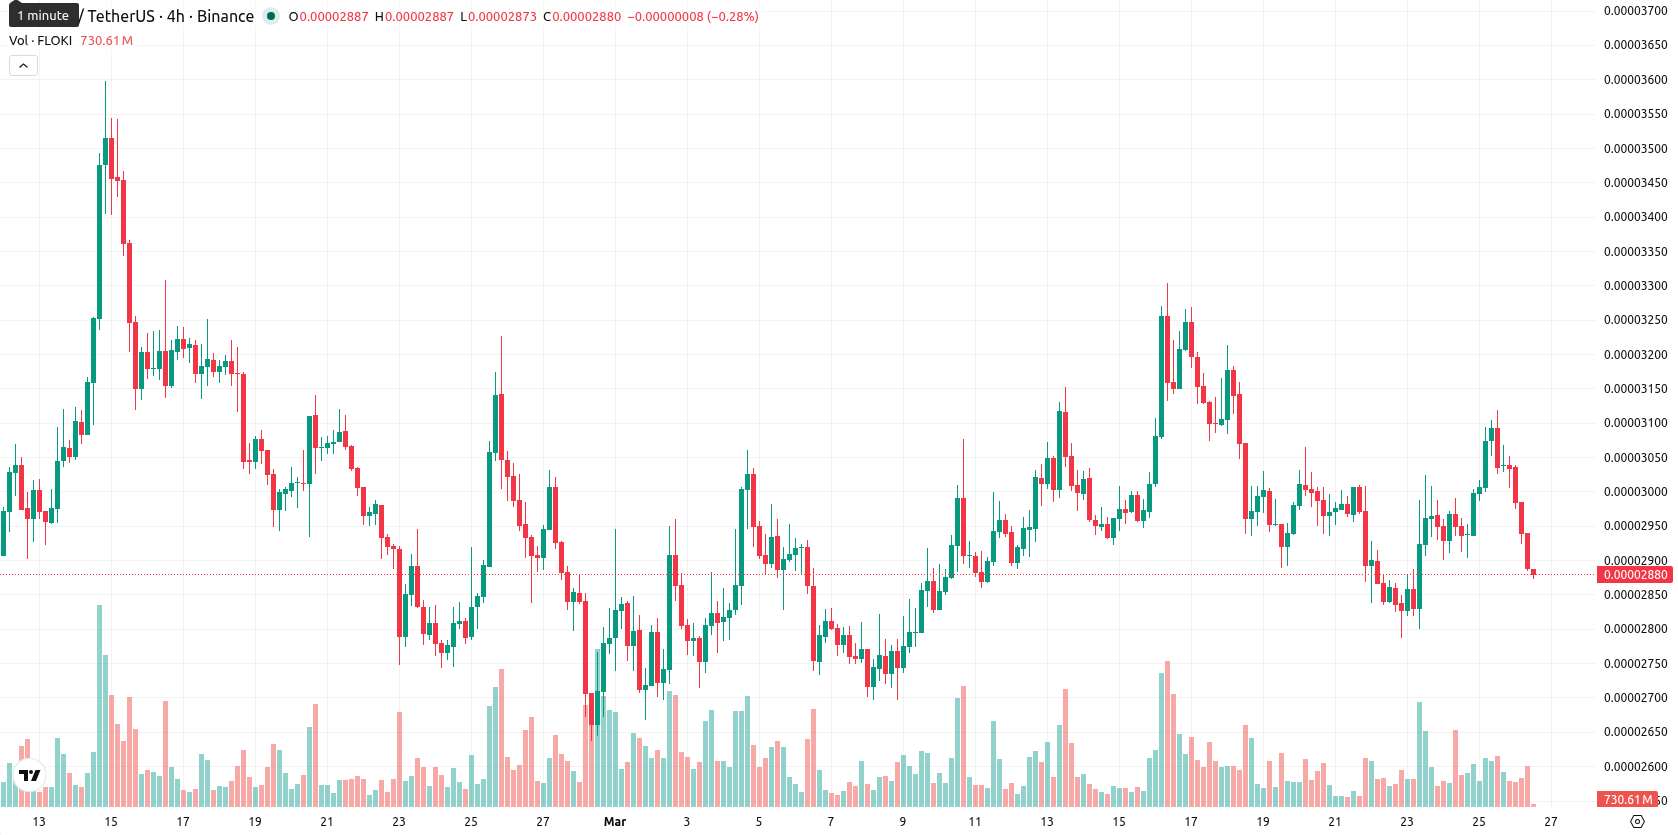
Floki Inu drops 7.20% as seller pressure holds price below key averages

Floki Inu (FLOKI) is trading at $0.0000288 after a decline of 7.20% today, placing it slightly below its SMA-20 ($0.00002949) and SMA-50 ($0.00002986), and well below the long-term SMA-200 ($0.00005372). This keeps FLOKI beneath key short- and medium-term moving averages, reflecting ongoing seller pressure, while the Ichimoku Kijun at $0.00002970 represents immediate resistance.
Highlights
- FLOKI ($) trades below key short- and medium-term moving averages, indicating sustained bearish pressure in the short term.
- Technical indicators show weak momentum and indecisive trend, as MACD signals strong sell and ADX remains subdued.
- Bearish continuation is likely with a projected five-day trading range of $0.0000260 to $0.0000295, and upside probability under 20%.
Weak daily momentum as oscillators diverge and selling deepens
Momentum on the daily timeframe is weak, with the MACD showing a strong sell signal and ADX at only 15.2, indicating an indecisive trend. Oscillator signals are mixed: RSI and CCI both indicate buy, while the Stoch RSI is neutral, and Bull/Bear Power (BBP) favors buyers in the D1 timeframe, although lower timeframes are dominated by sellers. The Awesome Oscillator remains neutral and does not confirm a particular direction. After opening just below the previous close, the price fell 7.2%, closing near the session's low — confirming high intraday volatility and pronounced selling after the open. Divergence between momentum and oscillator signals is visible, with intraday action validating overall weak momentum despite some higher timeframe buy signals.
Further downside risk as bearish trend indicators persist
In the next five trading days, the typical volatility band for FLOKI is expected between $0.0000260 and $0.0000295. The probability of a price rise remains very low (less than 20%), suggesting that a further decline is more likely. The base case is for continued sideways movement, as bulls must break above $0.0000297 resistance to regain control, while if current support fails, sellers may push the price toward the $0.0000260 region. Overall, downside risk persists, with both weekly and daily trend indicators remaining bearish, supported by weak MACD and ADX readings on the D1 and W1 timeframes.
Earlier, analysts noted that Floki Inu was experiencing range-bound trading with mixed momentum and persistent resistance, implying a cautious outlook for bulls. The latest technical setup reinforces this view, with sellers retaining overall control and downside risk heightened, making the $0.0000297 resistance a pivotal level to watch for any shift in direction.


-
 Afghanistan
-
 Albania
-
 Algeria
-
 Angola
-
 Argentina
-
 Armenia
-
 Australia
-
 Austria
-
 Azerbaijan
-
 Bahamas
-
 Bahrain
-
 Bangladesh
-
 Belarus
-
 Belgium
-
 Bolivia
-
 Botswana
-
 Brazil
-
 Brunei
-
 Bulgaria
-
 Cambodia
-
 Cameroon
-
 Canada
-
 Chile
Chile
-
 China
China
-
 Colombia
-
 Congo
Congo
-
 Costa Rica
-
 Cote d'Ivoire
-
 Croatia
-
 Cuba
Cuba
-
 Cyprus
-
 Czechia
-
 DR Congo
-
 Denmark
-
 Dominican Republic
-
 Ecuador
-
 Egypt
Egypt
-
 El Salvador
-
 Estonia
-
 Eswatini
-
 Ethiopia
-
 Finland
-
 France
-
 Georgia
-
 Germany
-
 Ghana
Ghana
-
 Greece
-
 Haiti
Haiti
-
 Hong Kong
-
 Hungary
-
 India
India
-
 Indonesia
-
 Iran, Islamic republic
-
 Iraq
Iraq
-
 Ireland
-
 Israel
-
 Italy
Italy
-
 Jamaica
-
 Japan
Japan
-
 Jordan
-
 Kazakhstan
-
 Kenya
Kenya
-
 Korea
Korea
-
 Kuwait
-
 Kyrgyzstan
-
 Laos
Laos
-
 Latvia
-
 Lebanon
-
 Lesotho
-
 Libya
Libya
-
 Lithuania
-
 Luxembourg
-
 Madagascar
-
 Malaysia
-
 Malta
Malta
-
 Mauritius
-
 Mexico
-
 Moldova
-
 Mongolia
-
 Montenegro
-
 Morocco
-
 Mozambique
-
 Myanmar
-
 Namibia
-
 Nepal
Nepal
-
 Netherlands
-
 New Zealand
-
 Nigeria
-
 North Macedonia
-
 Norway
-
 Oman
Oman
-
 Pakistan
-
 Palestine
-
 Panama
-
 Papua New Guinea
-
 Paraguay
-
 Peru
Peru
-
 Philippines
-
 Poland
-
 Portugal
-
 Puerto Rico
-
 Qatar
Qatar
-
 Reunion
-
 Romania
-
 Rwanda
-
 Saudi Arabia
-
 Serbia
-
 Singapore
-
 Slovakia
-
 Slovenia
-
 Somalia
-
 South Africa
-
 Spain
Spain
-
 Sri Lanka
-
 Sweden
-
 Switzerland
-
 Syria
Syria
-
 Taiwan
-
 Tajikistan
-
 Tanzania
-
 Thailand
-
 Trinidad and Tobago
-
 Tunisia
-
 Turkey
-
 UAE
UAE
-
 Uganda
-
 Ukraine
-
 United Kingdom
-
United States
-
 Uruguay
-
 Uzbekistan
-
 Venezuela
-
 Vietnam
-
 Yemen
Yemen
-
 Zambia
-
 Zimbabwe
- Forex
- Crypto
