
Sustained negative momentum sends Maple to session lows

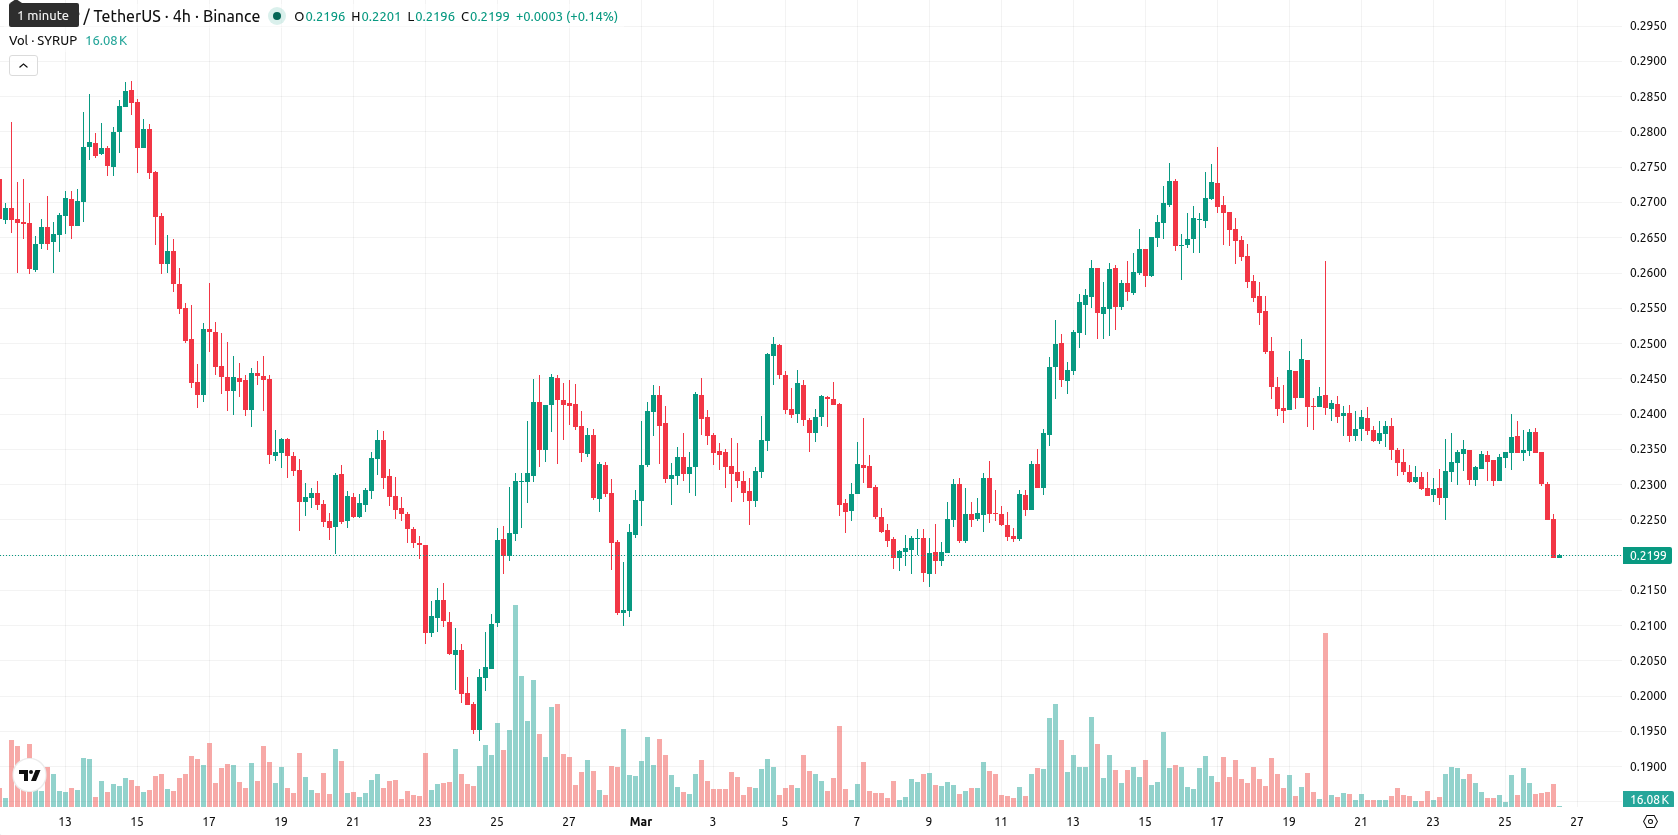
Maple (SYRUP) is trading at $0.2196 after a clear daily decline of 7.15%. The asset remains firmly below the SMA-20 ($0.2399), SMA-50 ($0.2456), and SMA-200 ($0.3361), signaling persistent selling pressure across all major timeframes, with the Ichimoku Kijun (D1) resistance at $0.2438 now overhead.
Highlights
- SYRUP is trading firmly below key moving averages, with sellers dominating across all timeframes and resistance near $0.244.
- Momentum and trend strength indicators, including MACD and ADX, confirm continued bearish sentiment and weak directional conviction.
- The expected price range over the next five days is $0.2140 to $0.2250, with downside risk prevailing and any rebound considered unlikely.
Bearish momentum persists amid weak oscillators and high volatility
Momentum indicators continue to reflect a bearish bias, as the MACD maintains a sell signal and the D1 ADX depicts a weak, trendless environment. The RSI remains subdued at 46 (sell), the Stoch RSI sits in oversold territory, and the CCI is neutral, hinting at limited potential for a technical rebound with little underlying conviction. BBP shows a marginally positive reading and a buy indication, potentially highlighting brief buyer attempts, while the AO strongly confirms the prevailing downtrend. Price closed near the low end of today’s range ($0.2195–$0.2346) with high intraday volatility after a gapless open, as negative momentum remains unchallenged by any strong oscillator divergence.
Downside risk dominates as volatility bands contain short-term movement
In the short term, SYRUP is projected to trade within a typical volatility band between $0.2140 and $0.2250 over the next five sessions. The probability of any material upside is very low (less than 20%), with major weekly indicators (MACD, RSI, ADX on W1) supporting a bias toward further decline or sideways movement in a narrow range. A bullish scenario requires a break above immediate resistance at $0.2438 to enable a short-lived rebound, while a breach below $0.2140 could accelerate downside momentum.
Earlier, analysts noted that Maple’s technical outlook was constrained by persistent selling pressure and limited upside momentum. The current setup reinforces this bearish sentiment, with downside risk intensifying and traders advised to monitor for a sustained break below $0.2140 as a signal of further weakness.


Latest Maple News


-
 Afghanistan
-
 Albania
-
 Algeria
-
 Angola
-
 Argentina
-
 Armenia
-
 Australia
-
 Austria
-
 Azerbaijan
-
 Bahamas
-
 Bahrain
-
 Bangladesh
-
 Belarus
-
 Belgium
-
 Bolivia
-
 Botswana
-
 Brazil
-
 Brunei
-
 Bulgaria
-
 Cambodia
-
 Cameroon
-
 Canada
-
 Chile
Chile
-
 China
China
-
 Colombia
-
 Congo
Congo
-
 Costa Rica
-
 Cote d'Ivoire
-
 Croatia
-
 Cuba
Cuba
-
 Cyprus
-
 Czechia
-
 DR Congo
-
 Denmark
-
 Dominican Republic
-
 Ecuador
-
 Egypt
Egypt
-
 El Salvador
-
 Estonia
-
 Eswatini
-
 Ethiopia
-
 Finland
-
 France
-
 Georgia
-
 Germany
-
 Ghana
Ghana
-
 Greece
-
 Haiti
Haiti
-
 Hong Kong
-
 Hungary
-
 India
India
-
 Indonesia
-
 Iran, Islamic republic
-
 Iraq
Iraq
-
 Ireland
-
 Israel
-
 Italy
Italy
-
 Jamaica
-
 Japan
Japan
-
 Jordan
-
 Kazakhstan
-
 Kenya
Kenya
-
 Korea
Korea
-
 Kuwait
-
 Kyrgyzstan
-
 Laos
Laos
-
 Latvia
-
 Lebanon
-
 Lesotho
-
 Libya
Libya
-
 Lithuania
-
 Luxembourg
-
 Madagascar
-
 Malaysia
-
 Malta
Malta
-
 Mauritius
-
 Mexico
-
 Moldova
-
 Mongolia
-
 Montenegro
-
 Morocco
-
 Mozambique
-
 Myanmar
-
 Namibia
-
 Nepal
Nepal
-
 Netherlands
-
 New Zealand
-
 Nigeria
-
 North Macedonia
-
 Norway
-
 Oman
Oman
-
 Pakistan
-
 Palestine
-
 Panama
-
 Papua New Guinea
-
 Paraguay
-
 Peru
Peru
-
 Philippines
-
 Poland
-
 Portugal
-
 Puerto Rico
-
 Qatar
Qatar
-
 Reunion
-
 Romania
-
 Rwanda
-
 Saudi Arabia
-
 Serbia
-
 Singapore
-
 Slovakia
-
 Slovenia
-
 Somalia
-
 South Africa
-
 Spain
Spain
-
 Sri Lanka
-
 Sweden
-
 Switzerland
-
 Syria
Syria
-
 Taiwan
-
 Tajikistan
-
 Tanzania
-
 Thailand
-
 Trinidad and Tobago
-
 Tunisia
-
 Turkey
-
 UAE
UAE
-
 Uganda
-
 Ukraine
-
 United Kingdom
-
United States
-
 Uruguay
-
 Uzbekistan
-
 Venezuela
-
 Vietnam
-
 Yemen
Yemen
-
 Zambia
-
 Zimbabwe
- Forex
- Crypto
