
Mixed momentum and high volatility push Kava lower on heavy selling

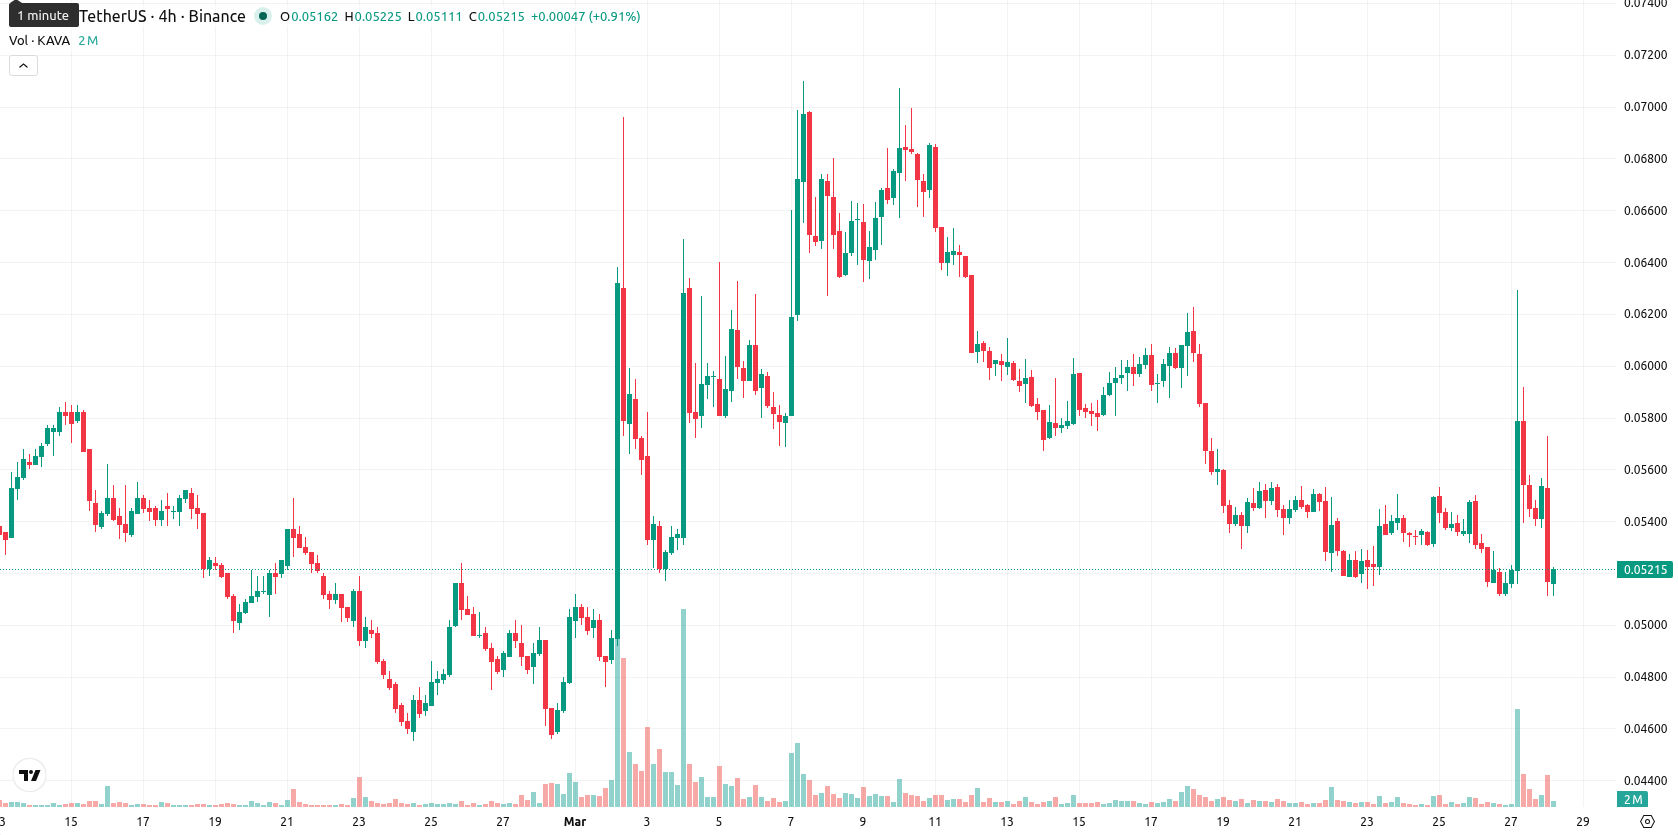
Kava (KAVA) is trading at $0.052, below its SMA-20 ($0.0582), SMA-50 ($0.0558), and significantly under the long-term SMA-200 ($0.1309), indicating pronounced bearish pressure across all timeframes. The Ichimoku Kijun level sits at $0.0598, which marks immediate resistance for the price.
 0.0454
0.0462
0.0454
0.0462
Highlights
- KAVA remains under notable selling pressure, trading below key moving averages, signaling a strong bearish trend across timeframes.
- Oscillator signals are mixed, with momentum mostly negative and trend strength characterized as weak and indecisive.
- Short-term trade is expected between $0.048 and $0.057, with downside risk prevailing unless resistance at $0.060 is decisively cleared.
Conflicting momentum and high volatility complicate bearish session
Momentum signals are mixed, with the D1 MACD showing a sell bias and ADX at a weak 17.6, suggesting limited trend strength. RSI sits just below neutral at 47.0 and indicates mild bearishness, while Stoch RSI signals a strong buy, creating a clear divergence with CCI's neutral value. BBP’s slight positive reading hints at moderate buyer interest during intraday moves, but the session saw a sharp drop of 11.34%, opening at $0.0553 after a minor gap down from $0.0587 with price now near the day’s low. Volatility has been high, and the overall intraday tone is heavy, as sellers maintained pressure after the open, despite conflicting oscillator and momentum signals.
Further downside favored as sell signals dominate short-term forecasts
Looking to the short term, the expected trading range for the coming week is adjusted to $0.048 – $0.057, reflecting a typical volatility band relative to current levels. With all weekly indicators (SMA-50, MACD, ADX, RSI) signaling sell, the probability of a price increase is very low (less than 20%), making a further decline much more likely. The baseline scenario is sideways movement within the defined corridor; a bullish case would require a decisive breakout above $0.060 (immediate resistance), while a bearish scenario may unfold on a clean break below $0.048 (recent intraday low and adjusted support).
Previously it was reported that Kava continued to face persistent bearish pressure amid mixed technical signals and sporadic attempts at a rebound. The current analysis reinforces this outlook, highlighting that a decisive break below the $0.048 support could accelerate further downside risk in the near term.








-
 Afghanistan
-
 Albania
-
 Algeria
-
 Angola
-
 Argentina
-
 Armenia
-
 Australia
-
 Austria
-
 Azerbaijan
-
 Bahamas
-
 Bahrain
-
 Bangladesh
-
 Belarus
-
 Belgium
-
 Bolivia
-
 Botswana
-
 Brazil
-
 Brunei
-
 Bulgaria
-
 Cambodia
-
 Cameroon
-
 Canada
-
 Chile
Chile
-
 China
China
-
 Colombia
-
 Congo
Congo
-
 Costa Rica
-
 Cote d'Ivoire
-
 Croatia
-
 Cuba
Cuba
-
 Cyprus
-
 Czechia
-
 DR Congo
-
 Denmark
-
 Dominican Republic
-
 Ecuador
-
 Egypt
Egypt
-
 El Salvador
-
 Estonia
-
 Eswatini
-
 Ethiopia
-
 Finland
-
 France
-
 Georgia
-
 Germany
-
 Ghana
Ghana
-
 Greece
-
 Haiti
Haiti
-
 Hong Kong
-
 Hungary
-
 India
India
-
 Indonesia
-
 Iran, Islamic republic
-
 Iraq
Iraq
-
 Ireland
-
 Israel
-
 Italy
Italy
-
 Jamaica
-
 Japan
Japan
-
 Jordan
-
 Kazakhstan
-
 Kenya
Kenya
-
 Korea
Korea
-
 Kuwait
-
 Kyrgyzstan
-
 Laos
Laos
-
 Latvia
-
 Lebanon
-
 Lesotho
-
 Libya
Libya
-
 Lithuania
-
 Luxembourg
-
 Madagascar
-
 Malaysia
-
 Malta
Malta
-
 Mauritius
-
 Mexico
-
 Moldova
-
 Mongolia
-
 Montenegro
-
 Morocco
-
 Mozambique
-
 Myanmar
-
 Namibia
-
 Nepal
Nepal
-
 Netherlands
-
 New Zealand
-
 Nigeria
-
 North Macedonia
-
 Norway
-
 Oman
Oman
-
 Pakistan
-
 Palestine
-
 Panama
-
 Papua New Guinea
-
 Paraguay
-
 Peru
Peru
-
 Philippines
-
 Poland
-
 Portugal
-
 Puerto Rico
-
 Qatar
Qatar
-
 Reunion
-
 Romania
-
 Rwanda
-
 Saudi Arabia
-
 Serbia
-
 Singapore
-
 Slovakia
-
 Slovenia
-
 Somalia
-
 South Africa
-
 Spain
Spain
-
 Sri Lanka
-
 Sweden
-
 Switzerland
-
 Syria
Syria
-
 Taiwan
-
 Tajikistan
-
 Tanzania
-
 Thailand
-
 Trinidad and Tobago
-
 Tunisia
-
 Turkey
-
 UAE
UAE
-
 Uganda
-
 Ukraine
-
 United Kingdom
-
United States
-
 Uruguay
-
 Uzbekistan
-
 Venezuela
-
 Vietnam
-
 Yemen
Yemen
-
 Zambia
-
 Zimbabwe
- Forex
- Crypto












