
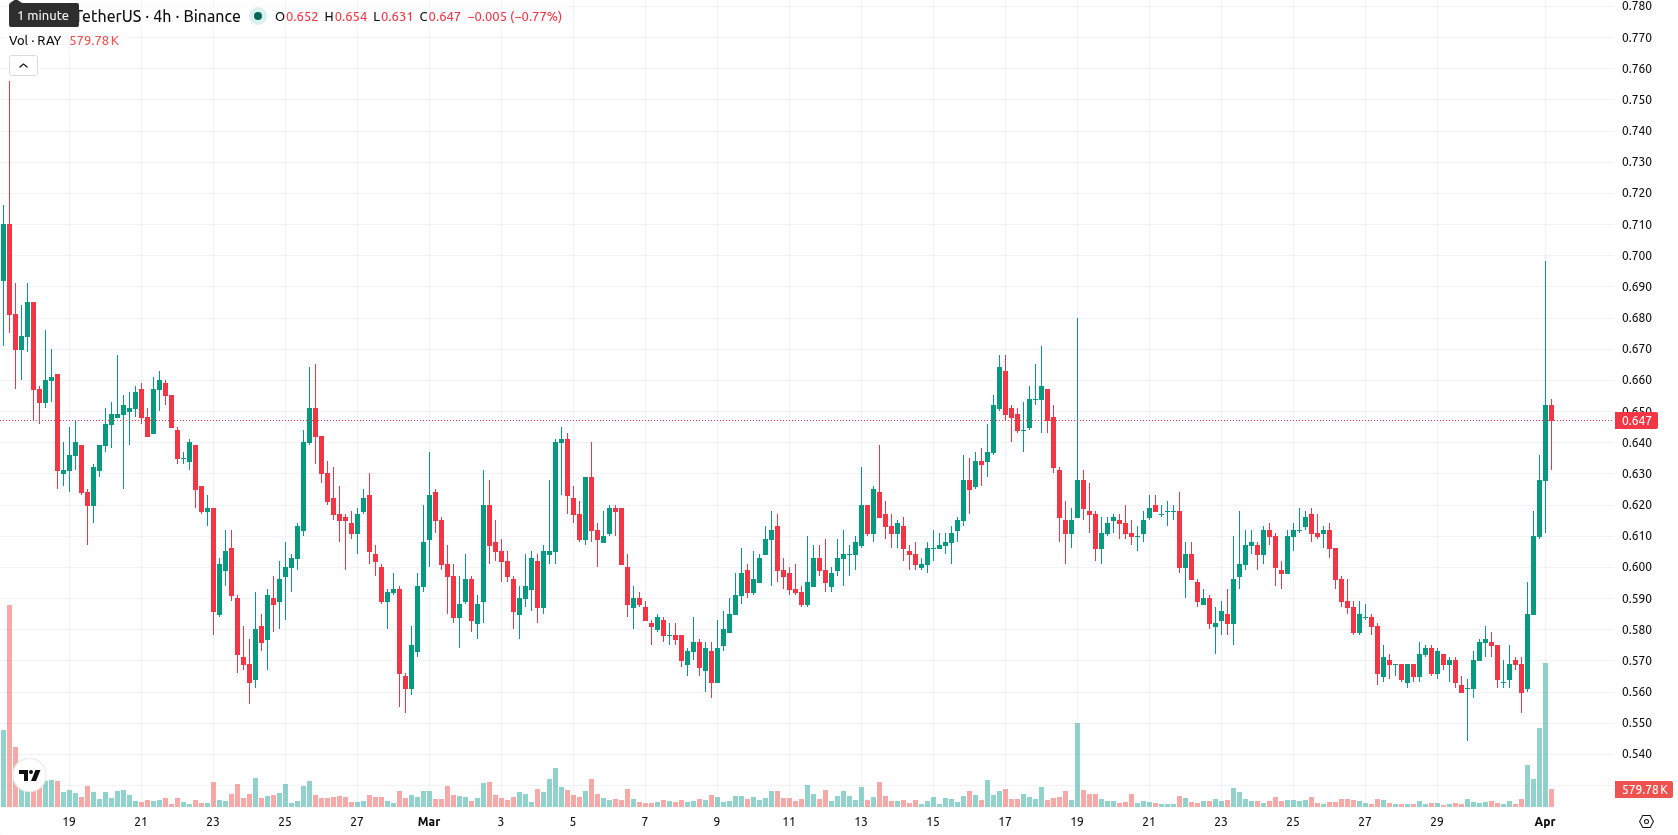
Raydium jumps 13.01% as technical signals highlight mixed short-term momentum

Raydium (RAY) is trading at $0.643, gaining 13.01% today. The price stands above both the MA-20 ($0.6048) and MA-50 ($0.6083), indicating short- to medium-term bullish momentum, but remains well below the MA-200 ($1.2969), reflecting continued long-term bearish pressure.
Highlights
- RAY shows short- to medium-term bullish momentum with price trading above key short-term technical supports, but remains under long-term bearish pressure.
- Momentum indicators present mixed signals, with some warning of overbought conditions and weak trend strength despite a strong daily performance.
- Price is expected to move sideways within the $0.615–$0.705 range next week, with increased probability of decline if it closes below $0.615.
Mixed momentum and high volatility amid long-term bearish bias
RAY trades above its MA-20 and MA-50, signaling positive momentum in the short and medium term, but is still far below the MA-200, which highlights ongoing long-term bearishness. The Ichimoku Kijun level at $0.6120 now acts as immediate support. Momentum indicators show mixed signals: D1 MACD issues a strong sell, ADX is neutral, RSI registers a solid 54.7 without being overbought, while Stoch RSI reads 100 and cautions of overbought conditions. Bull/Bear Power (BBP) suggests intraday buyer dominance, and CCI is neutral, all in the context of a high-volatility session with price hovering mid-range between $0.611 and $0.698.
Sideways trading likely as further upside faces resistance
For the short term, typical volatility suggests a price corridor of $0.615 to $0.705. The probability of further price gains is low (less than 20%), as weekly trend and momentum signals point to downside. The baseline expectation is sideways movement between $0.615 and $0.705. A close above $0.705 would be needed for a bullish scenario, while falling below $0.615 could lead to further losses toward previous support levels.
Earlier, analysts noted that Raydium was under persistent bearish momentum, urging close monitoring for a potential downside acceleration. The current recovery above key short- and medium-term averages introduces a cautious shift but, given ongoing long-term weakness, traders should closely monitor the $0.615 support as a decisive level for either renewed losses or further stabilization.


-
 Afghanistan
-
 Albania
-
 Algeria
-
 Angola
-
 Argentina
-
 Armenia
-
 Australia
-
 Austria
-
 Azerbaijan
-
 Bahamas
-
 Bahrain
-
 Bangladesh
-
 Belarus
-
 Belgium
-
 Bolivia
-
 Botswana
-
 Brazil
-
 Brunei
-
 Bulgaria
-
 Cambodia
-
 Cameroon
-
 Canada
-
 Chile
Chile
-
 China
China
-
 Colombia
-
 Congo
Congo
-
 Costa Rica
-
 Cote d'Ivoire
-
 Croatia
-
 Cuba
Cuba
-
 Cyprus
-
 Czechia
-
 DR Congo
-
 Denmark
-
 Dominican Republic
-
 Ecuador
-
 Egypt
Egypt
-
 El Salvador
-
 Estonia
-
 Eswatini
-
 Ethiopia
-
 Finland
-
 France
-
 Georgia
-
 Germany
-
 Ghana
Ghana
-
 Greece
-
 Haiti
Haiti
-
 Hong Kong
-
 Hungary
-
 India
India
-
 Indonesia
-
 Iran, Islamic republic
-
 Iraq
Iraq
-
 Ireland
-
 Israel
-
 Italy
Italy
-
 Jamaica
-
 Japan
Japan
-
 Jordan
-
 Kazakhstan
-
 Kenya
Kenya
-
 Korea
Korea
-
 Kuwait
-
 Kyrgyzstan
-
 Laos
Laos
-
 Latvia
-
 Lebanon
-
 Lesotho
-
 Libya
Libya
-
 Lithuania
-
 Luxembourg
-
 Madagascar
-
 Malaysia
-
 Malta
Malta
-
 Mauritius
-
 Mexico
-
 Moldova
-
 Mongolia
-
 Montenegro
-
 Morocco
-
 Mozambique
-
 Myanmar
-
 Namibia
-
 Nepal
Nepal
-
 Netherlands
-
 New Zealand
-
 Nigeria
-
 North Macedonia
-
 Norway
-
 Oman
Oman
-
 Pakistan
-
 Palestine
-
 Panama
-
 Papua New Guinea
-
 Paraguay
-
 Peru
Peru
-
 Philippines
-
 Poland
-
 Portugal
-
 Puerto Rico
-
 Qatar
Qatar
-
 Reunion
-
 Romania
-
 Rwanda
-
 Saudi Arabia
-
 Serbia
-
 Singapore
-
 Slovakia
-
 Slovenia
-
 Somalia
-
 South Africa
-
 Spain
Spain
-
 Sri Lanka
-
 Sweden
-
 Switzerland
-
 Syria
Syria
-
 Taiwan
-
 Tajikistan
-
 Tanzania
-
 Thailand
-
 Trinidad and Tobago
-
 Tunisia
-
 Turkey
-
 UAE
UAE
-
 Uganda
-
 Ukraine
-
 United Kingdom
-
United States
-
 Uruguay
-
 Uzbekistan
-
 Venezuela
-
 Vietnam
-
 Yemen
Yemen
-
 Zambia
-
 Zimbabwe
- Forex
- Crypto
