
Raydium: Overlapping resistance and weak trends push price near session lows

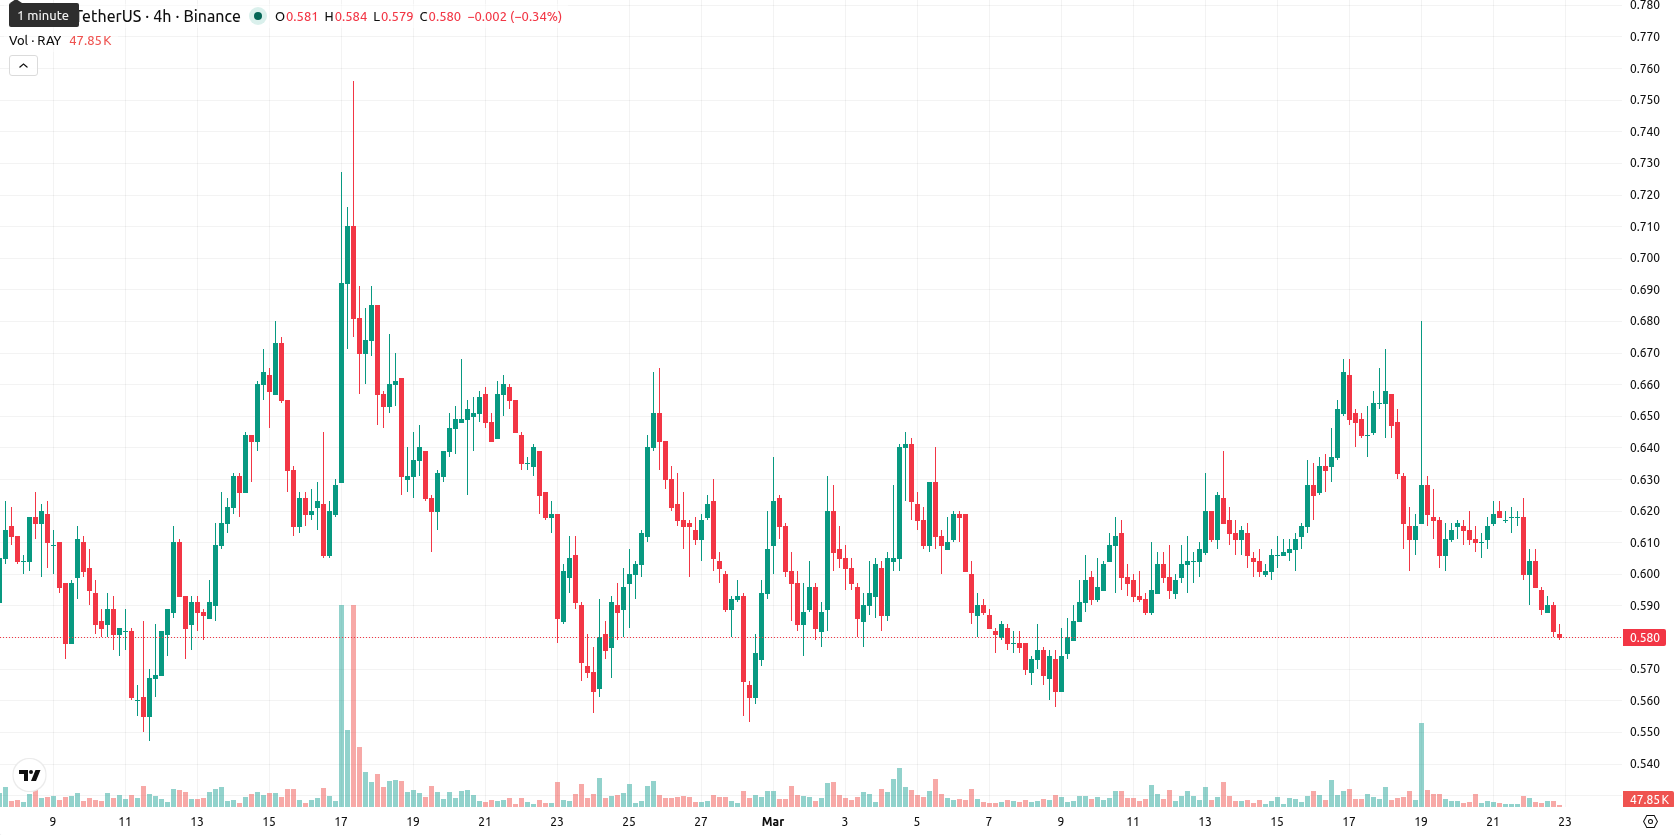
Raydium (RAY) is trading at $0.579, down 7.06% for the day and sitting well below the MA-20 ($0.6096), MA-50 ($0.6216), and MA-200 ($1.4367), highlighting strong seller dominance across all timeframes.
Highlights
- RAY remains in a clear bearish trend, trading well below major moving averages across all timeframes.
- Daily and weekly momentum indicators signal strong seller dominance and weak trend strength, with a very low chance of a near-term reversal.
- Expect RAY to trade between $0.56 and $0.64 over the next five days, with any drop below $0.56 likely accelerating further downside.
Bearish trend confirmed as technical signals and momentum weaken
RAY trades well below the MA-20 ($0.6096), MA-50 ($0.6216), and MA-200 ($1,4367), indicating clear seller dominance across short, medium, and long-term trends. The Ichimoku Kijun at $0.6165 stands as immediate resistance over the current price ($0.579). MACD and ADX on the daily chart both signal weak to negative momentum, with MACD giving a strong sell reading and ADX sitting at a low value, reflecting a lack of trend strength. RSI (48.7) points to slight bearish bias, while daily Stoch RSI and CCI are mixed — Stoch RSI hovers in neutral territory on D1 but is oversold on intraday frames, and CCI is neutral. BBP is slightly positive, indicating a marginal edge for buyers in intraday moves, though the broader momentum remains bearish. Awesome Oscillator is neutral, not reinforcing the downtrend at this stage. No significant gap was observed between the previous close and the open. The price has moved down 7.06% since yesterday, currently near the session low ($0.58 – $0.608 range), suggesting high intraday volatility and continued pressure after the open. Momentum and oscillators diverge: while BBP and Stoch RSI hint at potential bottom-fishing, the dominant trend signals remain bearish, with intraday price action confirming the sell bias.
Further declines likely as volatility bands expand under sell bias
Over the next five days, RAY is expected to trade within a volatility band relative to current levels, estimated in the $0.56 – $0.64 range to capture recent fluctuations. All weekly signals (RSI, ADX, MACD, and MA-50) indicate a strong sell or sell bias, implying less than a 20% chance of an upside move in the near term, with further price decreases more probable. The base case is for the price to remain under bearish pressure within this corridor. A bullish scenario would require RAY to reclaim and hold levels above the Ichimoku resistance, triggering short covering, while a decisive move below $0.56 may open the way for faster downside given the lack of clear support.
Earlier, analysts noted that Raydium was experiencing persistent bearish momentum and urged close monitoring for possible downside acceleration. The latest price action and momentum signals corroborate this view, with the next major risk event being a sustained break below $0.56, which could trigger a renewed wave of selling.


-
 Afghanistan
-
 Albania
-
 Algeria
-
 Angola
-
 Argentina
-
 Armenia
-
 Australia
-
 Austria
-
 Azerbaijan
-
 Bahamas
-
 Bahrain
-
 Bangladesh
-
 Belarus
-
 Belgium
-
 Bolivia
-
 Botswana
-
 Brazil
-
 Brunei
-
 Bulgaria
-
 Cambodia
-
 Cameroon
-
 Canada
-
 Chile
Chile
-
 China
China
-
 Colombia
-
 Congo
Congo
-
 Costa Rica
-
 Cote d'Ivoire
-
 Croatia
-
 Cuba
Cuba
-
 Cyprus
-
 Czechia
-
 DR Congo
-
 Denmark
-
 Dominican Republic
-
 Ecuador
-
 Egypt
Egypt
-
 El Salvador
-
 Estonia
-
 Eswatini
-
 Ethiopia
-
 Finland
-
 France
-
 Georgia
-
 Germany
-
 Ghana
Ghana
-
 Greece
-
 Haiti
Haiti
-
 Hong Kong
-
 Hungary
-
 India
India
-
 Indonesia
-
 Iran, Islamic republic
-
 Iraq
Iraq
-
 Ireland
-
 Israel
-
 Italy
Italy
-
 Jamaica
-
 Japan
Japan
-
 Jordan
-
 Kazakhstan
-
 Kenya
Kenya
-
 Korea
Korea
-
 Kuwait
-
 Kyrgyzstan
-
 Laos
Laos
-
 Latvia
-
 Lebanon
-
 Lesotho
-
 Libya
Libya
-
 Lithuania
-
 Luxembourg
-
 Madagascar
-
 Malaysia
-
 Malta
Malta
-
 Mauritius
-
 Mexico
-
 Moldova
-
 Mongolia
-
 Montenegro
-
 Morocco
-
 Mozambique
-
 Myanmar
-
 Namibia
-
 Nepal
Nepal
-
 Netherlands
-
 New Zealand
-
 Nigeria
-
 North Macedonia
-
 Norway
-
 Oman
Oman
-
 Pakistan
-
 Palestine
-
 Panama
-
 Papua New Guinea
-
 Paraguay
-
 Peru
Peru
-
 Philippines
-
 Poland
-
 Portugal
-
 Puerto Rico
-
 Qatar
Qatar
-
 Reunion
-
 Romania
-
 Rwanda
-
 Saudi Arabia
-
 Serbia
-
 Singapore
-
 Slovakia
-
 Slovenia
-
 Somalia
-
 South Africa
-
 Spain
Spain
-
 Sri Lanka
-
 Sweden
-
 Switzerland
-
 Syria
Syria
-
 Taiwan
-
 Tajikistan
-
 Tanzania
-
 Thailand
-
 Trinidad and Tobago
-
 Tunisia
-
 Turkey
-
 UAE
UAE
-
 Uganda
-
 Ukraine
-
 United Kingdom
-
United States
-
 Uruguay
-
 Uzbekistan
-
 Venezuela
-
 Vietnam
-
 Yemen
Yemen
-
 Zambia
-
 Zimbabwe
- Forex
- Crypto
