
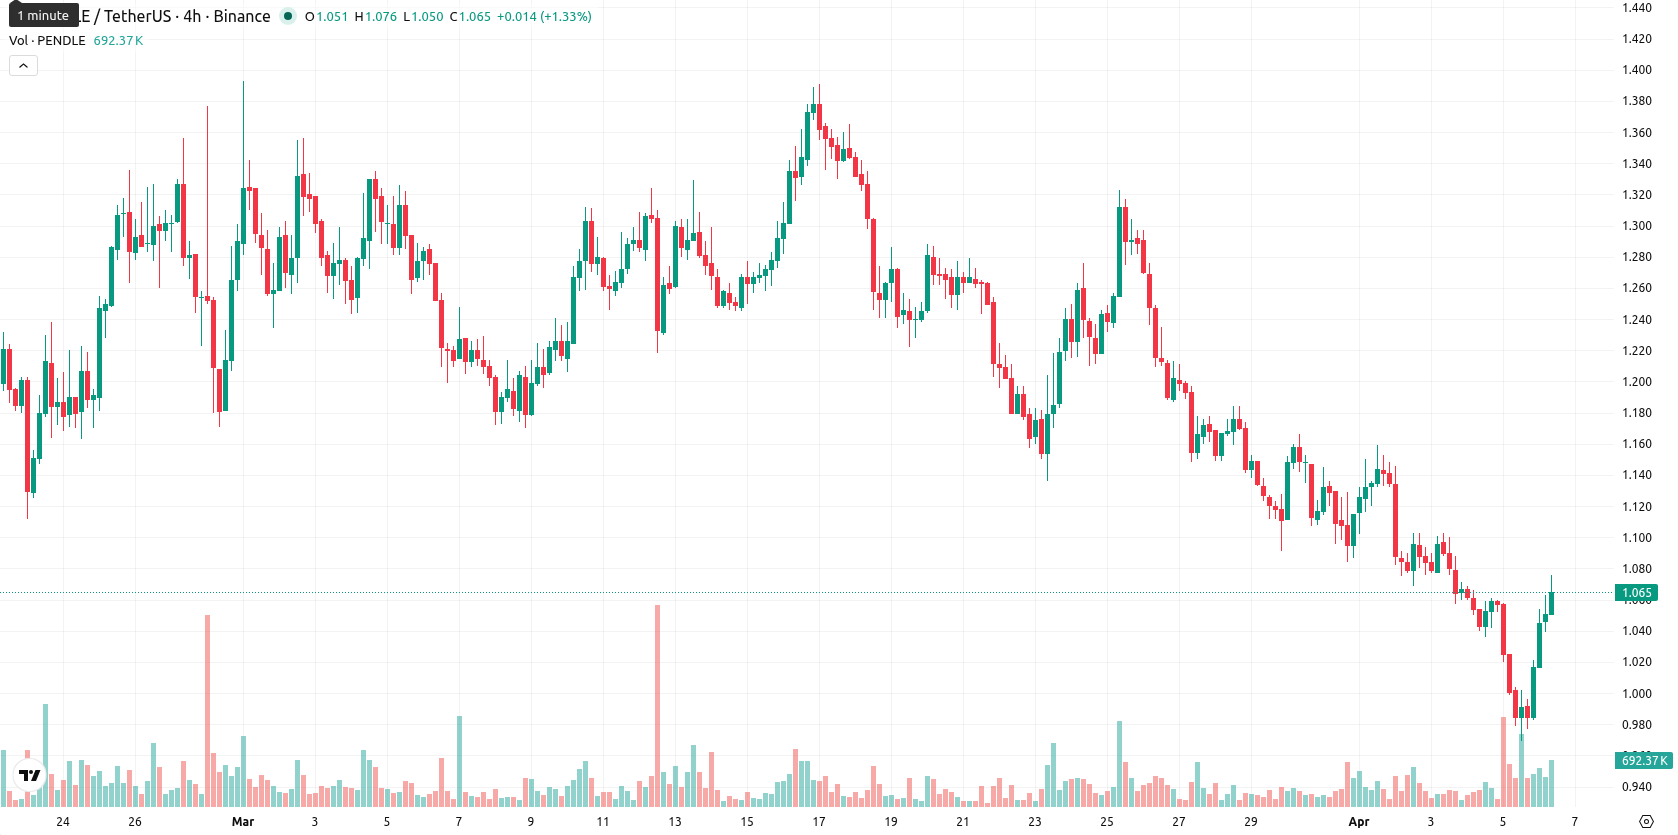
$1.04 support level drives Pendle higher by 7.00%

Pendle (PENDLE) is trading at $1.07, reflecting a 7.00% daily increase and positioning the token below its MA-20 ($1.1741), MA-50 ($1.2204), and MA-200 ($2,317.50), which signals ongoing bearishness across all primary timeframes. The current price sits beneath the Ichimoku Kijun resistance at $1.18, further highlighting persistent downward pressure.
Highlights
- PENDLE remains in a clear downtrend, trading below key moving averages, signaling sustained seller dominance across all timeframes.
- Momentum indicators confirm persistent bearish pressure, with weekly and daily signals aligning on a strong sell bias and oversold conditions.
- Price is likely to consolidate within the $1.04–$1.11 range this week, with a bearish breakdown below $1.04 risking deeper declines.
Volatile bounce as intraday momentum diverges from overall weakness
Momentum remains weak with both MACD and ADX on D1 signaling a sell bias, while D1 RSI is near the oversold area at 31.6, and Stoch RSI along with CCI confirm deeper oversold conditions. BBP is negative, supporting continued dominance by sellers, though a 7% daily gain signals bulls regained some traction without a gap at the open. The current price is near the upper end of today’s range ($1.017 – $1.076), suggesting high volatility and a strong tone toward session highs. Intraday momentum indicators are mixed compared to higher timeframe weakness, highlighting a divergence as the short-term bounce develops against overall negative trend signals.
Sideways trading likely as technical pressure favors further declines
For the week ahead, the expected range is $1.04 to $1.11, keeping price action within around 6% of current levels and reflecting typical volatility. The probability of a further price increase is very low (less than 20%), while a decline is much more likely given persistent “sell” readings across W1 RSI, ADX, MACD, and moving averages. Baseline scenario calls for sideways consolidation between $1.04 and $1.11. A bullish break above $1.11 would challenge resistance but lacks strong technical support; a bearish move below $1.04 could open the way to further downside, particularly if buyers fail to defend this week's lower boundary.
Previously it was reported that Pendle was entrenched in a sustained bearish trend, with market momentum and technical signals favoring continued downside pressure. While today's sharp intraday rebound highlights short-term volatility, the overall outlook remains cautious, and traders should monitor for a decisive move outside the $1.04–$1.11 range to signal the next directional shift.


-
 Afghanistan
-
 Albania
-
 Algeria
-
 Angola
-
 Argentina
-
 Armenia
-
 Australia
-
 Austria
-
 Azerbaijan
-
 Bahamas
-
 Bahrain
-
 Bangladesh
-
 Belarus
-
 Belgium
-
 Bolivia
-
 Botswana
-
 Brazil
-
 Brunei
-
 Bulgaria
-
 Cambodia
-
 Cameroon
-
 Canada
-
 Chile
Chile
-
 China
China
-
 Colombia
-
 Congo
Congo
-
 Costa Rica
-
 Cote d'Ivoire
-
 Croatia
-
 Cuba
Cuba
-
 Cyprus
-
 Czechia
-
 DR Congo
-
 Denmark
-
 Dominican Republic
-
 Ecuador
-
 Egypt
Egypt
-
 El Salvador
-
 Estonia
-
 Eswatini
-
 Ethiopia
-
 Finland
-
 France
-
 Georgia
-
 Germany
-
 Ghana
Ghana
-
 Greece
-
 Haiti
Haiti
-
 Hong Kong
-
 Hungary
-
 India
India
-
 Indonesia
-
 Iran, Islamic republic
-
 Iraq
Iraq
-
 Ireland
-
 Israel
-
 Italy
Italy
-
 Jamaica
-
 Japan
Japan
-
 Jordan
-
 Kazakhstan
-
 Kenya
Kenya
-
 Korea
Korea
-
 Kuwait
-
 Kyrgyzstan
-
 Laos
Laos
-
 Latvia
-
 Lebanon
-
 Lesotho
-
 Libya
Libya
-
 Lithuania
-
 Luxembourg
-
 Madagascar
-
 Malaysia
-
 Malta
Malta
-
 Mauritius
-
 Mexico
-
 Moldova
-
 Mongolia
-
 Montenegro
-
 Morocco
-
 Mozambique
-
 Myanmar
-
 Namibia
-
 Nepal
Nepal
-
 Netherlands
-
 New Zealand
-
 Nigeria
-
 North Macedonia
-
 Norway
-
 Oman
Oman
-
 Pakistan
-
 Palestine
-
 Panama
-
 Papua New Guinea
-
 Paraguay
-
 Peru
Peru
-
 Philippines
-
 Poland
-
 Portugal
-
 Puerto Rico
-
 Qatar
Qatar
-
 Reunion
-
 Romania
-
 Rwanda
-
 Saudi Arabia
-
 Serbia
-
 Singapore
-
 Slovakia
-
 Slovenia
-
 Somalia
-
 South Africa
-
 Spain
Spain
-
 Sri Lanka
-
 Sweden
-
 Switzerland
-
 Syria
Syria
-
 Taiwan
-
 Tajikistan
-
 Tanzania
-
 Thailand
-
 Trinidad and Tobago
-
 Tunisia
-
 Turkey
-
 UAE
UAE
-
 Uganda
-
 Ukraine
-
 United Kingdom
-
United States
-
 Uruguay
-
 Uzbekistan
-
 Venezuela
-
 Vietnam
-
 Yemen
Yemen
-
 Zambia
-
 Zimbabwe
- Forex
- Crypto
