
SOL ticks up as negative MACD signals outweigh brief climb near $84: weekly report

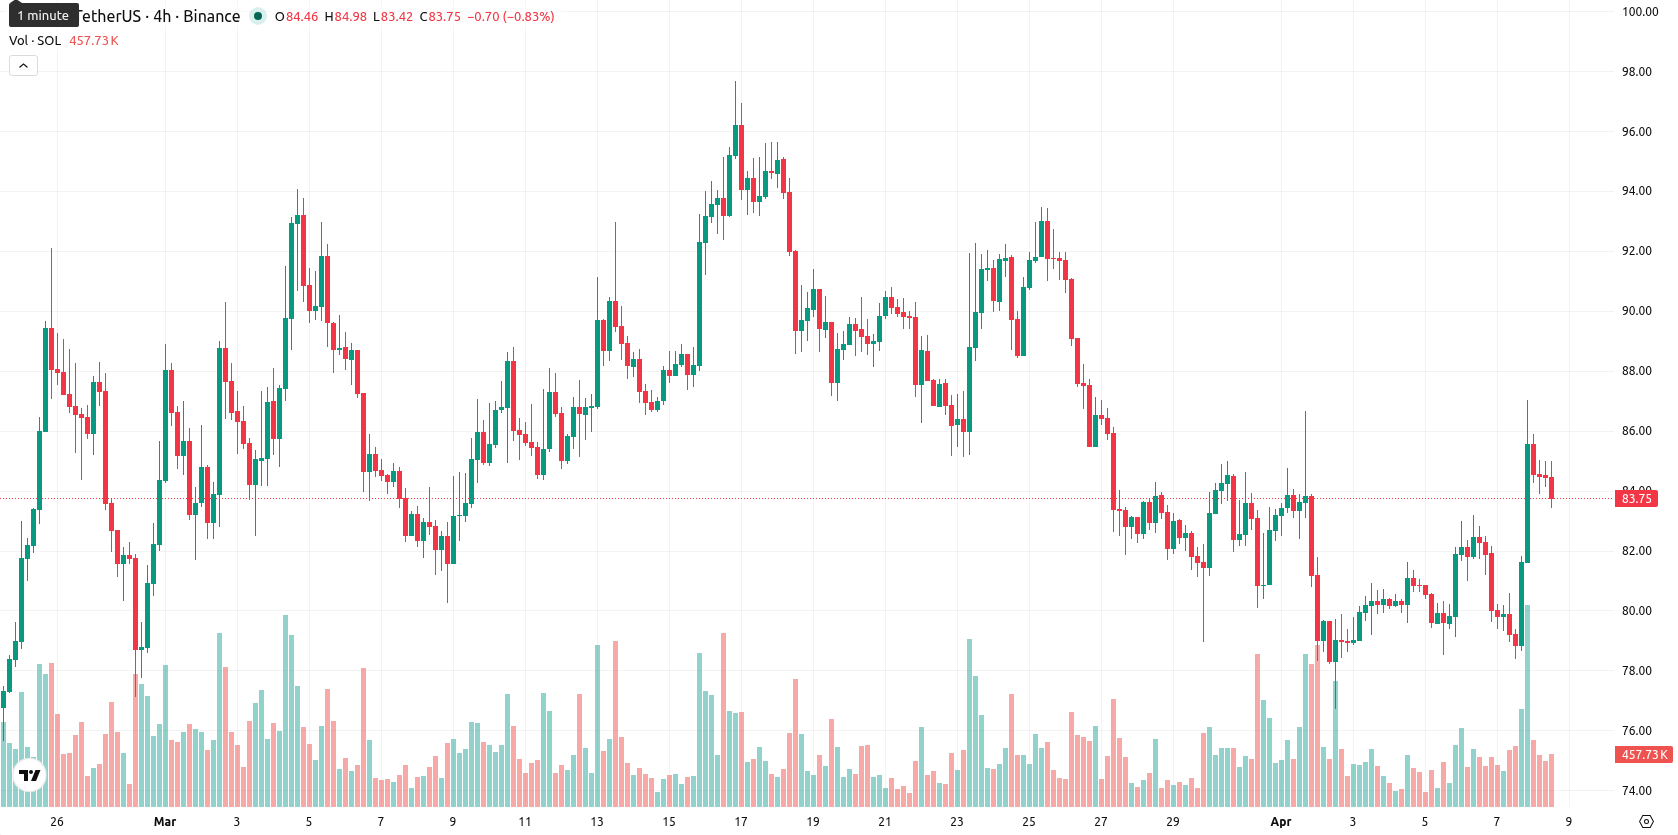
Solana (SOL) is trading at $84.19, marking a weekly gain of $1.52 or 1.74% from the previous close. The asset remains well below its key weekly moving averages, with the price positioned beneath the MA-20 ($106.30), MA-50 ($149.84), and MA-200 ($104.56), confirming continued medium- and long-term pressure from sellers.
Highlights
- Solana trades below major moving averages, signaling sustained medium- and long-term selling pressure from bears.
- Momentum and oscillator signals remain bearish, with sellers dominating trend strength and an overall downward market bias.
- SOL is expected to remain rangebound between $81.00 and $87.30 this week, with a higher risk of downside continuation.
Sentiment boosted this week by DeFi security upgrades and regulatory clarity
The Solana Foundation introduced STRIDE and the Solana Incident Response Network (SIRN), enhancing DeFi protocol security through new monitoring and coordinated response systems, following a major exploit impacting the Drift Protocol. Joint regulatory clarification by the US SEC and CFTC classified Solana as a digital commodity, supporting institutional adoption and clarifying staking and validator activities. Additional developments included SOL Strategies' acquisition of Darklake Labs for advanced privacy features and B2C2's inclusion of Solana in its stablecoin settlement infrastructure.
Bearish momentum confirmed as weekly indicators highlight seller control
Technical analysis on the weekly timeframe confirms ongoing bearish momentum for SOL. The price remains substantially below the MA-20, MA-50, and MA-200, with the MA-20 ($106.30) acting as the nearest dynamic resistance. Weekly indicators reinforce this negative bias, as MACD signals a strong sell, ADX confirms a selling trend, and both the RSI and Commodity Channel Index point to continued downward pressure. Bull/Bear Power has reached -10.41 (oversold) on the weekly chart, indicating robust seller dominance despite SOL trading in the upper part of its recent weekly range and volatility measured at 13.46%.
Sideways range forecast for next week amid persistent seller dominance
Over the next 7 days, SOL is likely to oscillate within a range of $81.00 to $87.30, given present volatility and technical conditions. The probability of a sustained upward move remains very low, with momentum and oscillator readings suggesting that sellers continue to control the trend. Sideways action is the base scenario, but a break below $81 would favor further declines, while only a decisive move above $87.30 would open the door for short-term bullish advances, which are considered unlikely in the current setup.
Previously it was reported that Solana faced prolonged selling pressure despite enhanced security measures and efforts to sustain institutional confidence. The current analysis reaffirms this bearish momentum, with sellers maintaining control and a break below $81 serving as a critical downside risk for traders to monitor in the near term.


Latest Solana News


-
 Afghanistan
-
 Albania
-
 Algeria
-
 Angola
-
 Argentina
-
 Armenia
-
 Australia
-
 Austria
-
 Azerbaijan
-
 Bahamas
-
 Bahrain
-
 Bangladesh
-
 Belarus
-
 Belgium
-
 Bolivia
-
 Botswana
-
 Brazil
-
 Brunei
-
 Bulgaria
-
 Cambodia
-
 Cameroon
-
 Canada
-
 Chile
Chile
-
 China
China
-
 Colombia
-
 Congo
Congo
-
 Costa Rica
-
 Cote d'Ivoire
-
 Croatia
-
 Cuba
Cuba
-
 Cyprus
-
 Czechia
-
 DR Congo
-
 Denmark
-
 Dominican Republic
-
 Ecuador
-
 Egypt
Egypt
-
 El Salvador
-
 Estonia
-
 Eswatini
-
 Ethiopia
-
 Finland
-
 France
-
 Georgia
-
 Germany
-
 Ghana
Ghana
-
 Greece
-
 Haiti
Haiti
-
 Hong Kong
-
 Hungary
-
 India
India
-
 Indonesia
-
 Iran, Islamic republic
-
 Iraq
Iraq
-
 Ireland
-
 Israel
-
 Italy
Italy
-
 Jamaica
-
 Japan
Japan
-
 Jordan
-
 Kazakhstan
-
 Kenya
Kenya
-
 Korea
Korea
-
 Kuwait
-
 Kyrgyzstan
-
 Laos
Laos
-
 Latvia
-
 Lebanon
-
 Lesotho
-
 Libya
Libya
-
 Lithuania
-
 Luxembourg
-
 Madagascar
-
 Malaysia
-
 Malta
Malta
-
 Mauritius
-
 Mexico
-
 Moldova
-
 Mongolia
-
 Montenegro
-
 Morocco
-
 Mozambique
-
 Myanmar
-
 Namibia
-
 Nepal
Nepal
-
 Netherlands
-
 New Zealand
-
 Nigeria
-
 North Macedonia
-
 Norway
-
 Oman
Oman
-
 Pakistan
-
 Palestine
-
 Panama
-
 Papua New Guinea
-
 Paraguay
-
 Peru
Peru
-
 Philippines
-
 Poland
-
 Portugal
-
 Puerto Rico
-
 Qatar
Qatar
-
 Reunion
-
 Romania
-
 Rwanda
-
 Saudi Arabia
-
 Serbia
-
 Singapore
-
 Slovakia
-
 Slovenia
-
 Somalia
-
 South Africa
-
 Spain
Spain
-
 Sri Lanka
-
 Sweden
-
 Switzerland
-
 Syria
Syria
-
 Taiwan
-
 Tajikistan
-
 Tanzania
-
 Thailand
-
 Trinidad and Tobago
-
 Tunisia
-
 Turkey
-
 UAE
UAE
-
 Uganda
-
 Ukraine
-
 United Kingdom
-
United States
-
 Uruguay
-
 Uzbekistan
-
 Venezuela
-
 Vietnam
-
 Yemen
Yemen
-
 Zambia
-
 Zimbabwe
- Forex
- Crypto
