
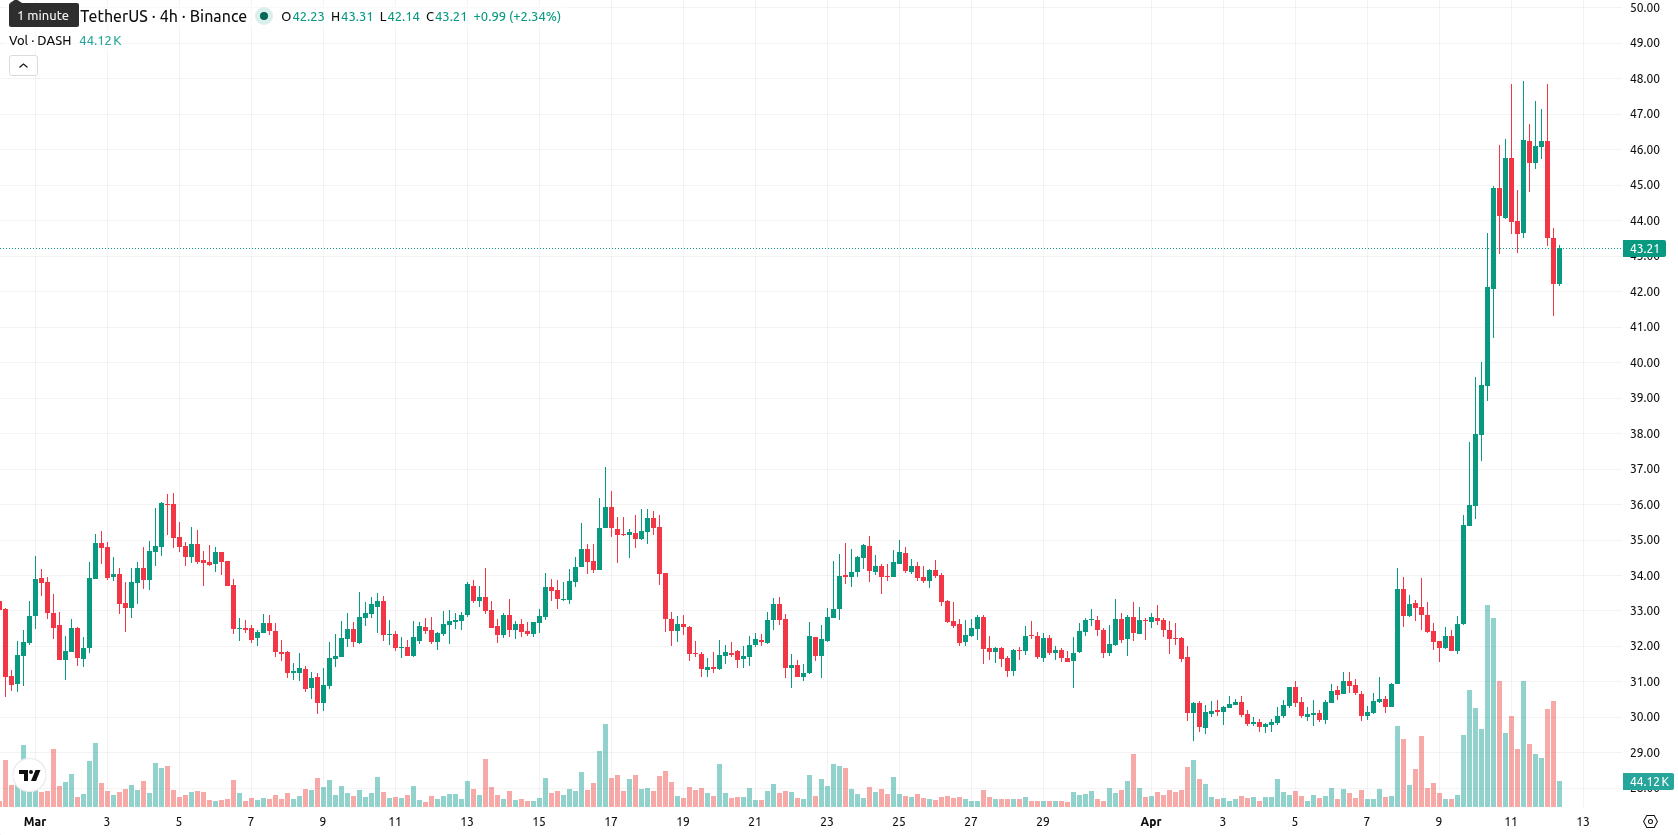
-7.02% for Dash as sellers push the crypto to fresh daily lows

Dash (DASH) is trading at $43.20, posting a daily decline of 7.02%. The asset is positioned above both the SMA-20 ($33.61) and SMA-50 ($33.26), indicating persistent short- to medium-term bullish momentum, but remains under the SMA-200 ($46.28), which acts as long-term resistance.
Highlights
- DASH is exhibiting short- and medium-term bullish momentum but faces sustained resistance at the long-term moving average level.
- Momentum remains firm, yet overbought technical indicators and intraday selling pressure signal increased short-term downside risk.
- Price is expected to fluctuate between $39.56 and $47.00 over the next week, with further declines more likely than gains.
Overbought signals and weak trend amid high volatility
Technically, the Ichimoku Kijun level on the D1 timeframe is at $38.61, serving as immediate support beneath the current price. The MACD on D1 indicates ongoing upside momentum, but a weak ADX of 12.44 signals that the trend lacks strength. Overbought signals are shown by RSI (75.97), Stochastic RSI (100.00), and CCI (327.07), while the BBP also confirms buyer dominance in the recent move. The Awesome Oscillator is neutral, and price action is close to today's low after a gap down, reflecting high intraday volatility and strong selling pressure following the open.
Sideways trading favored as upside probability declines
Over the next five trading days, DASH is expected to remain within a volatility band of $39.56 to $47.00. Probability of upward movement is low (less than 20%), with declines more likely according to the W1 MACD and mixed long-term indicators. The baseline scenario anticipates sideways price action within this corridor. An upside break above immediate resistance could push toward the upper band, while a bearish move below support may bring a test of the lower $39 level.
Previously it was reported that Dash exhibited persistent short- to medium-term bullish momentum despite caution over overbought technicals and weak trend strength. The current pullback and increased selling pressure introduce greater downside risk in the coming sessions, making the $39.56 support area a critical level to monitor for potential further declines or stabilization.


Latest Dash News


-
 Afghanistan
-
 Albania
-
 Algeria
-
 Angola
-
 Argentina
-
 Armenia
-
 Australia
-
 Austria
-
 Azerbaijan
-
 Bahamas
-
 Bahrain
-
 Bangladesh
-
 Belarus
-
 Belgium
-
 Bolivia
-
 Botswana
-
 Brazil
-
 Brunei
-
 Bulgaria
-
 Cambodia
-
 Cameroon
-
 Canada
-
 Chile
Chile
-
 China
China
-
 Colombia
-
 Congo
Congo
-
 Costa Rica
-
 Cote d'Ivoire
-
 Croatia
-
 Cuba
Cuba
-
 Cyprus
-
 Czechia
-
 DR Congo
-
 Denmark
-
 Dominican Republic
-
 Ecuador
-
 Egypt
Egypt
-
 El Salvador
-
 Estonia
-
 Eswatini
-
 Ethiopia
-
 Finland
-
 France
-
 Georgia
-
 Germany
-
 Ghana
Ghana
-
 Greece
-
 Haiti
Haiti
-
 Hong Kong
-
 Hungary
-
 India
India
-
 Indonesia
-
 Iran, Islamic republic
-
 Iraq
Iraq
-
 Ireland
-
 Israel
-
 Italy
Italy
-
 Jamaica
-
 Japan
Japan
-
 Jordan
-
 Kazakhstan
-
 Kenya
Kenya
-
 Korea
Korea
-
 Kuwait
-
 Kyrgyzstan
-
 Laos
Laos
-
 Latvia
-
 Lebanon
-
 Lesotho
-
 Libya
Libya
-
 Lithuania
-
 Luxembourg
-
 Madagascar
-
 Malaysia
-
 Malta
Malta
-
 Mauritius
-
 Mexico
-
 Moldova
-
 Mongolia
-
 Montenegro
-
 Morocco
-
 Mozambique
-
 Myanmar
-
 Namibia
-
 Nepal
Nepal
-
 Netherlands
-
 New Zealand
-
 Nigeria
-
 North Macedonia
-
 Norway
-
 Oman
Oman
-
 Pakistan
-
 Palestine
-
 Panama
-
 Papua New Guinea
-
 Paraguay
-
 Peru
Peru
-
 Philippines
-
 Poland
-
 Portugal
-
 Puerto Rico
-
 Qatar
Qatar
-
 Reunion
-
 Romania
-
 Rwanda
-
 Saudi Arabia
-
 Serbia
-
 Singapore
-
 Slovakia
-
 Slovenia
-
 Somalia
-
 South Africa
-
 Spain
Spain
-
 Sri Lanka
-
 Sweden
-
 Switzerland
-
 Syria
Syria
-
 Taiwan
-
 Tajikistan
-
 Tanzania
-
 Thailand
-
 Trinidad and Tobago
-
 Tunisia
-
 Turkey
-
 UAE
UAE
-
 Uganda
-
 Ukraine
-
 United Kingdom
-
United States
-
 Uruguay
-
 Uzbekistan
-
 Venezuela
-
 Vietnam
-
 Yemen
Yemen
-
 Zambia
-
 Zimbabwe
- Forex
- Crypto
