
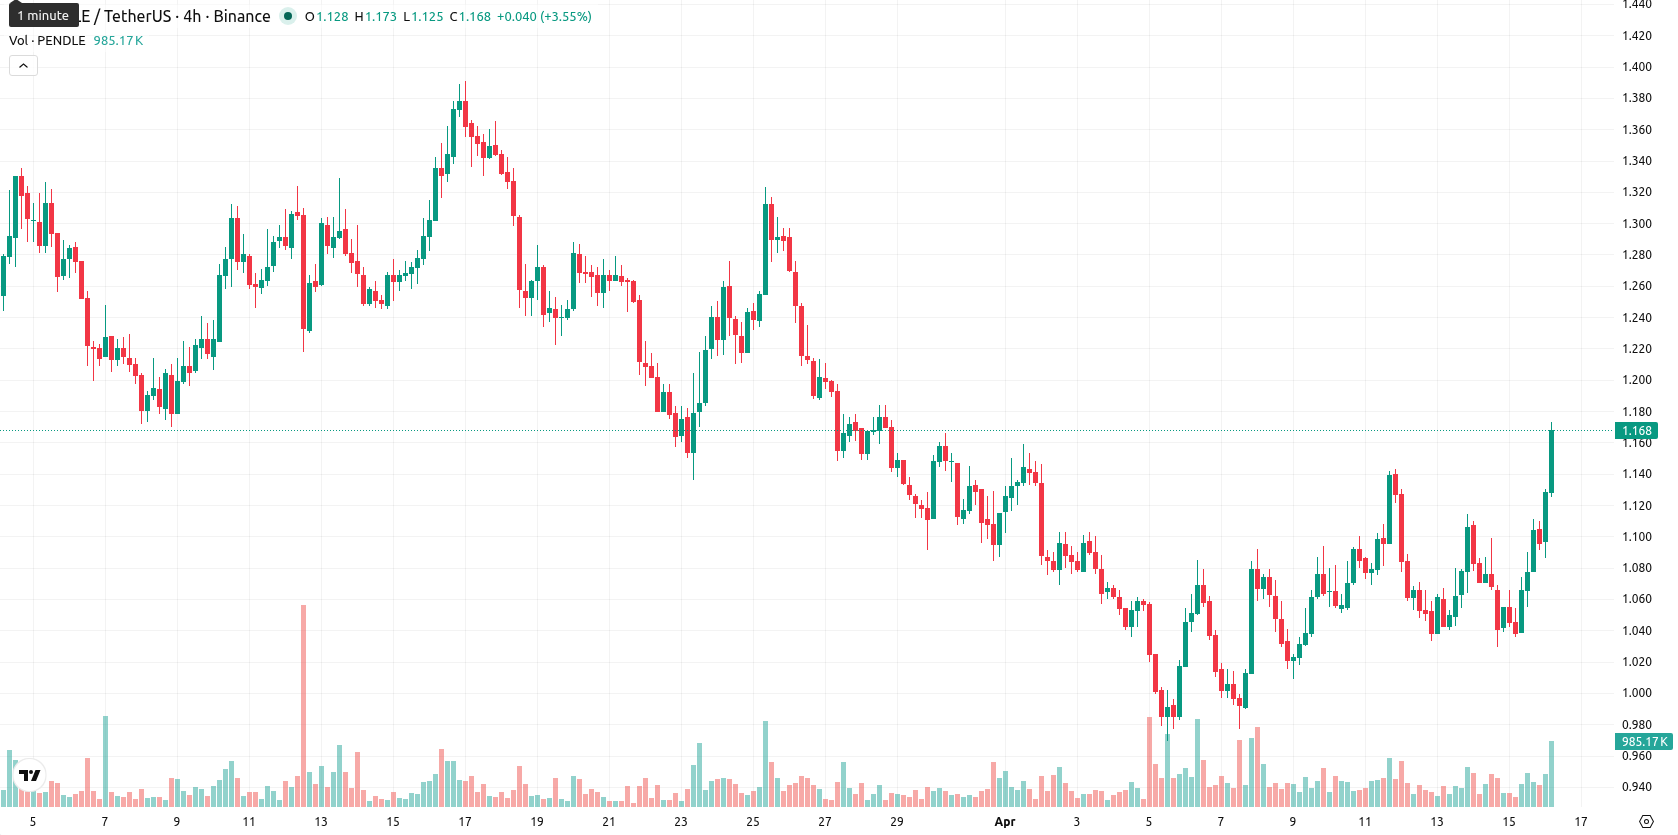
+12.60% for Pendle as near-term momentum fades after recent rally

Pendle (PENDLE) is trading at $1.171, up 12.6% for the day and positioned above its MA-20 ($1.0849), but just under the MA-50 ($1.1915), indicating short-term bullish momentum, though medium-term resistance persists.
Highlights
- PENDLE surged 12.6% intraday, holding near session highs and flipping immediate resistance into support at $1.1460.
- Strong intraday buying contrasts with weak underlying momentum, as most trend indicators remain bearish or neutral.
- Price is likely to consolidate between $1.14 and $1.22 over the next five days, with further downside risk prevailing.
Mixed momentum as MA-200 limits, oscillators signal uncertainty
PENDLE's short-term technical setup is constructive, with price action above the MA-20 and just below the MA-50, suggesting ongoing bullish momentum in the near term, though the asset remains well below the longer-term MA-200 ($2.1283), highlighting sustained bearish pressure. Immediate resistance was previously identified at the Ichimoku Kijun level of $1.1460, but with price now above this threshold, it acts as immediate support. Daily chart momentum signals are mixed: the MACD and ADX indicate 'Sell,' pointing to weak underlying trend strength, while Stoch RSI is overbought, RSI is neutral to bearish at 47.6, CCI is near neutral, Bull/Bear Power (BBP) shows strong buyer dominance, and the Awesome Oscillator remains inconclusive.
Sideways scenario favored as indicators reinforce downside risk
Looking ahead, PENDLE is expected to trade within a typical volatility band between $1.14 and $1.22 over the next five days, matching recent market volatility and current levels. The likelihood of further price increases is low (under 20%), with key weekly indicators (RSI, ADX, MACD, MA-50) signaling downside pressure. The base scenario points to sideways consolidation in the $1.14 – $1.22 range. A move above $1.22 could target higher resistance, while a drop below $1.14 may trigger a retest of lower support levels.
Earlier, analysts noted that Pendle was experiencing short-term bullish momentum amid persistent medium- and long-term bearish pressure, with sideways consolidation expected to dominate. The latest technical readings confirm this outlook, suggesting traders should closely monitor for a breakout above $1.22 or a breakdown below $1.14, as either could signal a shift away from the current consolidation range.


-
 Afghanistan
-
 Albania
-
 Algeria
-
 Angola
-
 Argentina
-
 Armenia
-
 Australia
-
 Austria
-
 Azerbaijan
-
 Bahamas
-
 Bahrain
-
 Bangladesh
-
 Belarus
-
 Belgium
-
 Bolivia
-
 Botswana
-
 Brazil
-
 Brunei
-
 Bulgaria
-
 Cambodia
-
 Cameroon
-
 Canada
-
 Chile
Chile
-
 China
China
-
 Colombia
-
 Congo
Congo
-
 Costa Rica
-
 Cote d'Ivoire
-
 Croatia
-
 Cuba
Cuba
-
 Cyprus
-
 Czechia
-
 DR Congo
-
 Denmark
-
 Dominican Republic
-
 Ecuador
-
 Egypt
Egypt
-
 El Salvador
-
 Estonia
-
 Eswatini
-
 Ethiopia
-
 Finland
-
 France
-
 Georgia
-
 Germany
-
 Ghana
Ghana
-
 Greece
-
 Haiti
Haiti
-
 Hong Kong
-
 Hungary
-
 India
India
-
 Indonesia
-
 Iran, Islamic republic
-
 Iraq
Iraq
-
 Ireland
-
 Israel
-
 Italy
Italy
-
 Jamaica
-
 Japan
Japan
-
 Jordan
-
 Kazakhstan
-
 Kenya
Kenya
-
 Korea
Korea
-
 Kuwait
-
 Kyrgyzstan
-
 Laos
Laos
-
 Latvia
-
 Lebanon
-
 Lesotho
-
 Libya
Libya
-
 Lithuania
-
 Luxembourg
-
 Madagascar
-
 Malaysia
-
 Malta
Malta
-
 Mauritius
-
 Mexico
-
 Moldova
-
 Mongolia
-
 Montenegro
-
 Morocco
-
 Mozambique
-
 Myanmar
-
 Namibia
-
 Nepal
Nepal
-
 Netherlands
-
 New Zealand
-
 Nigeria
-
 North Macedonia
-
 Norway
-
 Oman
Oman
-
 Pakistan
-
 Palestine
-
 Panama
-
 Papua New Guinea
-
 Paraguay
-
 Peru
Peru
-
 Philippines
-
 Poland
-
 Portugal
-
 Puerto Rico
-
 Qatar
Qatar
-
 Reunion
-
 Romania
-
 Rwanda
-
 Saudi Arabia
-
 Serbia
-
 Singapore
-
 Slovakia
-
 Slovenia
-
 Somalia
-
 South Africa
-
 Spain
Spain
-
 Sri Lanka
-
 Sweden
-
 Switzerland
-
 Syria
Syria
-
 Taiwan
-
 Tajikistan
-
 Tanzania
-
 Thailand
-
 Trinidad and Tobago
-
 Tunisia
-
 Turkey
-
 UAE
UAE
-
 Uganda
-
 Ukraine
-
 United Kingdom
-
United States
-
 Uruguay
-
 Uzbekistan
-
 Venezuela
-
 Vietnam
-
 Yemen
Yemen
-
 Zambia
-
 Zimbabwe
- Forex
- Crypto
