
Injective climbs 12.04% facing resistance near $3.60 in recent range: weekly review

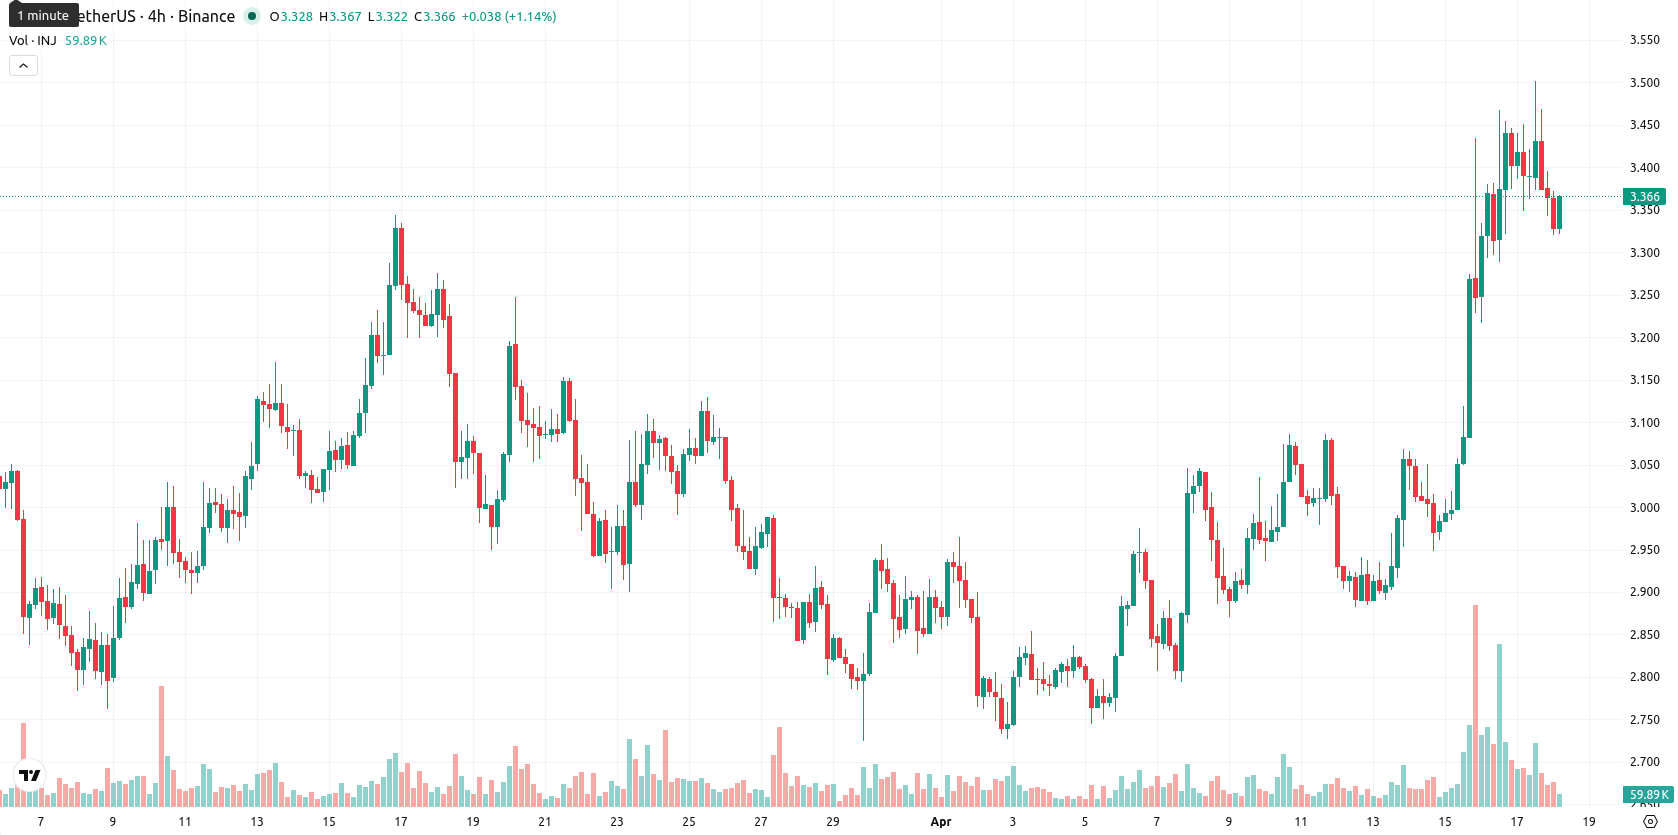
Injective (INJ) is currently trading at $3.35, rising $0.36 (12.04%) over the past week. The asset remains below the weekly MA-20 ($3.83), MA-50 ($8.44), and MA-200 ($12.94), signaling continued medium- and long-term bearish momentum.
Highlights
- INJ remains under medium- and long-term bearish pressure, trading below major moving averages and dynamic resistance.
- Momentum signals, including MACD and ADX, indicate a bearish bias with sellers maintaining control despite recent gains.
- INJ is expected to consolidate between $3.10 and $3.60 over the next week, with downside or sideways movement most likely.
Persisting downside bias as indicators flag weak momentum this week
On the weekly (W1) chart, INJ is firmly beneath all major moving averages, with MA-20 at $3.83 serving as dynamic resistance and the Kijun line well above current price action. Key support lies at $3.10 while immediate resistance is at $3.60, reflecting this week's range. Momentum indicators remain broadly negative: MACD gives a "Strong Sell" signal, ADX suggests selling pressure, and RSI signals weakness at 36.25. Stochastic RSI at 100.00 indicates a risk of overbought conditions, while the CCI remains neutral, Awesome Oscillator lacks a clear trend, and Bull/Bear Power is slightly negative at -0.02.
Sideways consolidation expected as technicals cap upside next week
For the next 7 days, the forecast suggests INJ will likely trade between $3.10 and $3.60, consolidating within the upper part of this weekly range. Technicals do not indicate a high probability of an upside breakout, as no major indicator supports a Buy signal. The baseline scenario is continued sideways or slightly lower movement. A bullish push above $3.60 could trigger short-term momentum, but this is unlikely, while a break below $3.10 would reinforce prevailing bearish sentiment.
Earlier, analysts noted that Injective was showing short-term bullish momentum while still facing lingering bearish pressure from longer-term trends. This week’s persistent weakness below all major moving averages reinforces those headwinds, and traders should watch for a break below $3.10 as confirmation of a continued downside scenario.


Latest Injective News


-
 Afghanistan
-
 Albania
-
 Algeria
-
 Angola
-
 Argentina
-
 Armenia
-
 Australia
-
 Austria
-
 Azerbaijan
-
 Bahamas
-
 Bahrain
-
 Bangladesh
-
 Belarus
-
 Belgium
-
 Bolivia
-
 Botswana
-
 Brazil
-
 Brunei
-
 Bulgaria
-
 Cambodia
-
 Cameroon
-
 Canada
-
 Chile
Chile
-
 China
China
-
 Colombia
-
 Congo
Congo
-
 Costa Rica
-
 Cote d'Ivoire
-
 Croatia
-
 Cuba
Cuba
-
 Cyprus
-
 Czechia
-
 DR Congo
-
 Denmark
-
 Dominican Republic
-
 Ecuador
-
 Egypt
Egypt
-
 El Salvador
-
 Estonia
-
 Eswatini
-
 Ethiopia
-
 Finland
-
 France
-
 Georgia
-
 Germany
-
 Ghana
Ghana
-
 Greece
-
 Haiti
Haiti
-
 Hong Kong
-
 Hungary
-
 India
India
-
 Indonesia
-
 Iran, Islamic republic
-
 Iraq
Iraq
-
 Ireland
-
 Israel
-
 Italy
Italy
-
 Jamaica
-
 Japan
Japan
-
 Jordan
-
 Kazakhstan
-
 Kenya
Kenya
-
 Korea
Korea
-
 Kuwait
-
 Kyrgyzstan
-
 Laos
Laos
-
 Latvia
-
 Lebanon
-
 Lesotho
-
 Libya
Libya
-
 Lithuania
-
 Luxembourg
-
 Madagascar
-
 Malaysia
-
 Malta
Malta
-
 Mauritius
-
 Mexico
-
 Moldova
-
 Mongolia
-
 Montenegro
-
 Morocco
-
 Mozambique
-
 Myanmar
-
 Namibia
-
 Nepal
Nepal
-
 Netherlands
-
 New Zealand
-
 Nigeria
-
 North Macedonia
-
 Norway
-
 Oman
Oman
-
 Pakistan
-
 Palestine
-
 Panama
-
 Papua New Guinea
-
 Paraguay
-
 Peru
Peru
-
 Philippines
-
 Poland
-
 Portugal
-
 Puerto Rico
-
 Qatar
Qatar
-
 Reunion
-
 Romania
-
 Rwanda
-
 Saudi Arabia
-
 Serbia
-
 Singapore
-
 Slovakia
-
 Slovenia
-
 Somalia
-
 South Africa
-
 Spain
Spain
-
 Sri Lanka
-
 Sweden
-
 Switzerland
-
 Syria
Syria
-
 Taiwan
-
 Tajikistan
-
 Tanzania
-
 Thailand
-
 Trinidad and Tobago
-
 Tunisia
-
 Turkey
-
 UAE
UAE
-
 Uganda
-
 Ukraine
-
 United Kingdom
-
United States
-
 Uruguay
-
 Uzbekistan
-
 Venezuela
-
 Vietnam
-
 Yemen
Yemen
-
 Zambia
-
 Zimbabwe
- Forex
- Crypto
