
Continued weakness near long-term levels weighs on PENDLE drop

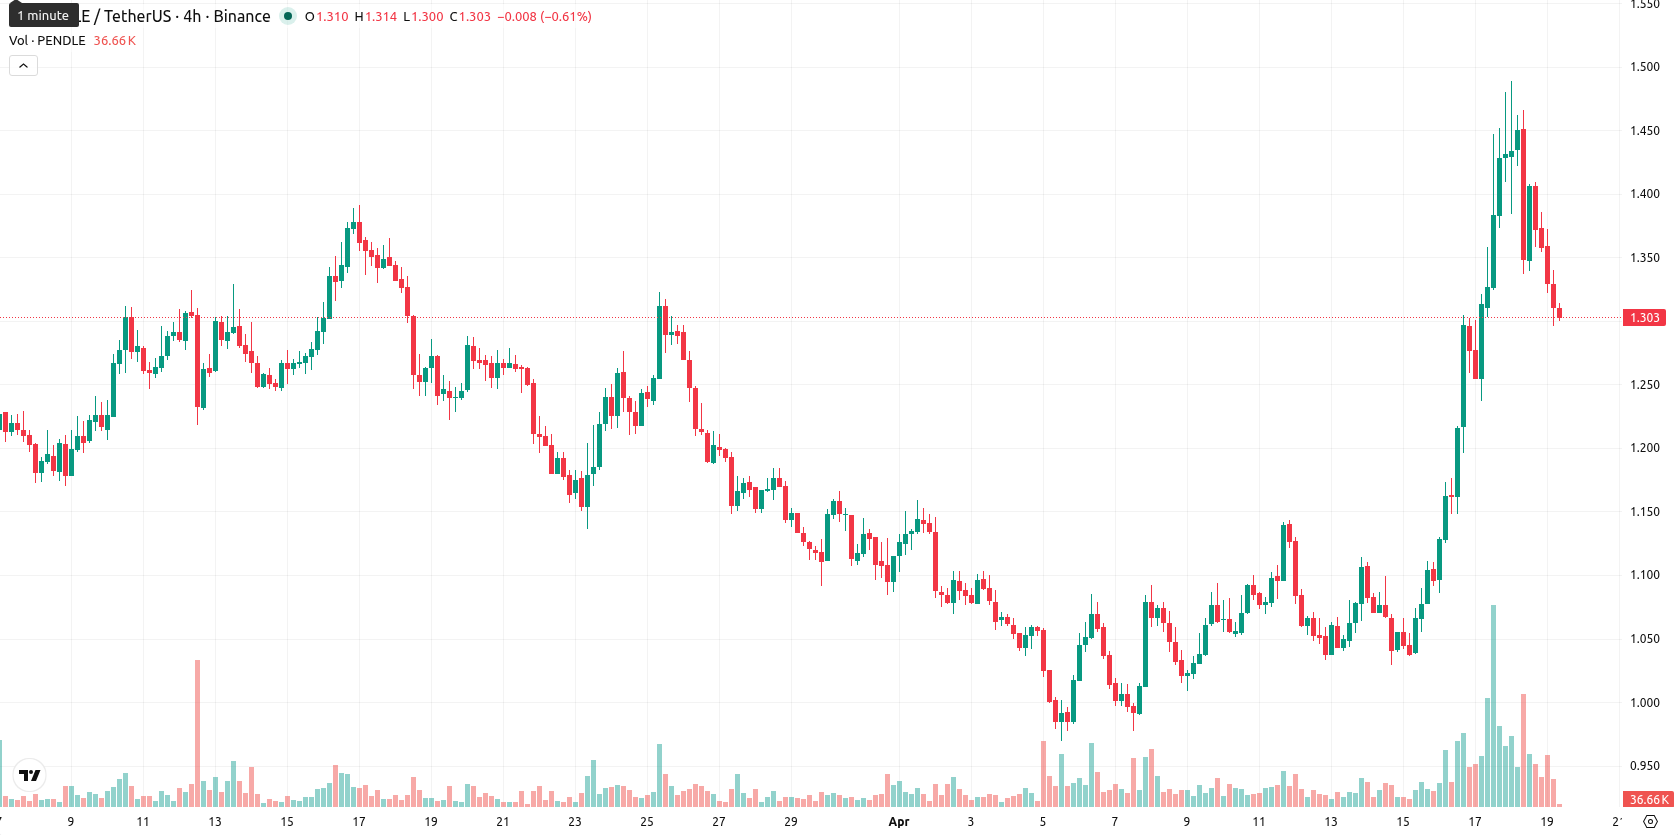
Pendle (PENDLE) is currently trading at $1.307, above both the SMA-20 ($1.1177) and SMA-50 ($1.1963), but well below the SMA-200 ($2.0785), signaling a sustained short- and medium-term bullish trend with long-term resistance still overhead. The Ichimoku Kijun level sits at $1.2290, which is below the current price and thus acts as immediate support.
Highlights
- PENDLE trades above its short- and medium-term trend levels but remains well below long-term resistance, signaling a limited bullish window.
- Momentum indicators are mixed with emerging overbought conditions and strong intraday volatility, raising caution for further upside.
- The likely trading range for the next five sessions is $1.27–$1.36, with downside favored unless $1.36 is decisively breached.
Mixed momentum and overbought signals amid heightened volatility
Momentum signals are mixed: ADX on D1 indicates moderate bullish momentum while MACD stays neutral, but RSI and CCI suggest overbought conditions are developing. Stoch RSI also flags overbought levels, signaling caution, though BBP remains positive and suggests buyers continue to dominate intraday. The Awesome Oscillator supports the underlying upward trend. Today's session shows pronounced volatility, with prices opening at $1.359 (no significant gap from the previous close of $1.45), falling sharply by 9.86%. The current price is near the session’s low of $1.296, reflecting persistent pressure after the open, and intraday volatility is high. The divergence between overbought oscillators and strong D1 momentum points to a potential short-term pause or pullback.
Further downside risk as technical weakness persists
For the coming five trading days, the expected trading range is $1.27 to $1.36. The probability of a price increase is very low (less than 20%), making a further decline more likely given strong bearish signals from W1 indicators (RSI, ADX, MACD, and moving averages all point to weakness). The baseline scenario is sideways movement in the $1.27 — $1.36 corridor. A bullish case would require a clear break above $1.36, signaling renewed buyer strength; in a bearish scenario, a drop below $1.27 would confirm accelerated downside risk.
Earlier, analysts noted that Pendle was exhibiting short- and medium-term bullish momentum but faced the risk of an overbought pullback. The latest session underscores mounting downside pressure and heightened volatility, making the $1.27 level a crucial support to monitor for potential trend shifts in the days ahead.


-
 Afghanistan
-
 Albania
-
 Algeria
-
 Angola
-
 Argentina
-
 Armenia
-
 Australia
-
 Austria
-
 Azerbaijan
-
 Bahamas
-
 Bahrain
-
 Bangladesh
-
 Belarus
-
 Belgium
-
 Bolivia
-
 Botswana
-
 Brazil
-
 Brunei
-
 Bulgaria
-
 Cambodia
-
 Cameroon
-
 Canada
-
 Chile
Chile
-
 China
China
-
 Colombia
-
 Congo
Congo
-
 Costa Rica
-
 Cote d'Ivoire
-
 Croatia
-
 Cuba
Cuba
-
 Cyprus
-
 Czechia
-
 DR Congo
-
 Denmark
-
 Dominican Republic
-
 Ecuador
-
 Egypt
Egypt
-
 El Salvador
-
 Estonia
-
 Eswatini
-
 Ethiopia
-
 Finland
-
 France
-
 Georgia
-
 Germany
-
 Ghana
Ghana
-
 Greece
-
 Haiti
Haiti
-
 Hong Kong
-
 Hungary
-
 India
India
-
 Indonesia
-
 Iran, Islamic republic
-
 Iraq
Iraq
-
 Ireland
-
 Israel
-
 Italy
Italy
-
 Jamaica
-
 Japan
Japan
-
 Jordan
-
 Kazakhstan
-
 Kenya
Kenya
-
 Korea
Korea
-
 Kuwait
-
 Kyrgyzstan
-
 Laos
Laos
-
 Latvia
-
 Lebanon
-
 Lesotho
-
 Libya
Libya
-
 Lithuania
-
 Luxembourg
-
 Madagascar
-
 Malaysia
-
 Malta
Malta
-
 Mauritius
-
 Mexico
-
 Moldova
-
 Mongolia
-
 Montenegro
-
 Morocco
-
 Mozambique
-
 Myanmar
-
 Namibia
-
 Nepal
Nepal
-
 Netherlands
-
 New Zealand
-
 Nigeria
-
 North Macedonia
-
 Norway
-
 Oman
Oman
-
 Pakistan
-
 Palestine
-
 Panama
-
 Papua New Guinea
-
 Paraguay
-
 Peru
Peru
-
 Philippines
-
 Poland
-
 Portugal
-
 Puerto Rico
-
 Qatar
Qatar
-
 Reunion
-
 Romania
-
 Rwanda
-
 Saudi Arabia
-
 Serbia
-
 Singapore
-
 Slovakia
-
 Slovenia
-
 Somalia
-
 South Africa
-
 Spain
Spain
-
 Sri Lanka
-
 Sweden
-
 Switzerland
-
 Syria
Syria
-
 Taiwan
-
 Tajikistan
-
 Tanzania
-
 Thailand
-
 Trinidad and Tobago
-
 Tunisia
-
 Turkey
-
 UAE
UAE
-
 Uganda
-
 Ukraine
-
 United Kingdom
-
United States
-
 Uruguay
-
 Uzbekistan
-
 Venezuela
-
 Vietnam
-
 Yemen
Yemen
-
 Zambia
-
 Zimbabwe
- Forex
- Crypto
