
+1.16% for Solana as price climbs off long-term lows

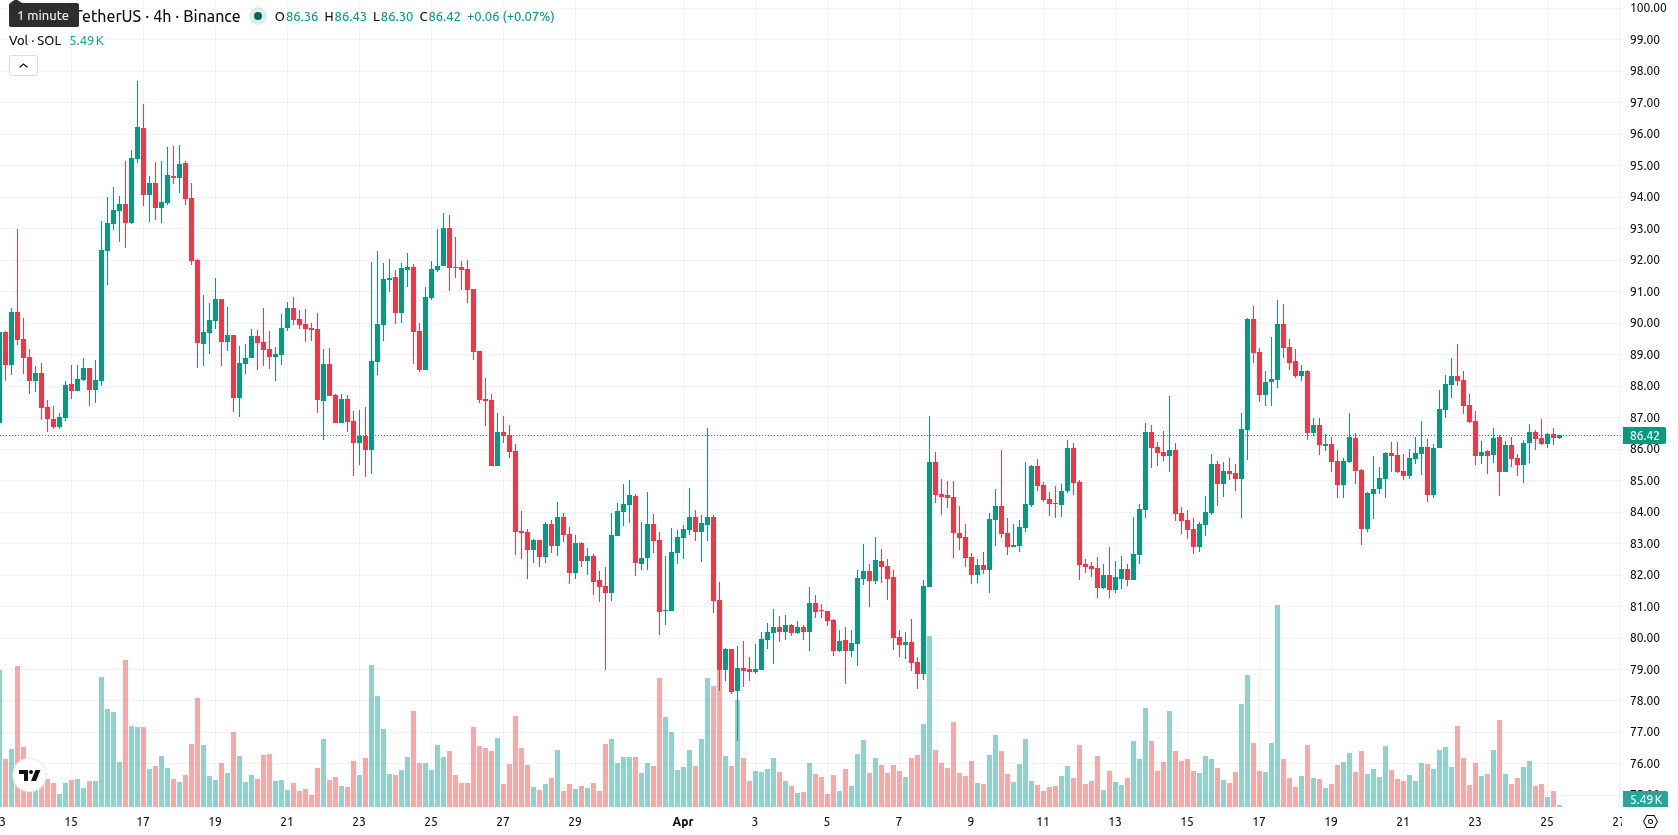
Solana (SOL) is trading at $86.44, up 1.16% on the day and currently positioned above its short- and medium-term moving averages while remaining well below major long-term averages.
Highlights
- Solana price volatility increased last week, driven by external geopolitical risks such as the Binance flash crash and tensions involving Iran.
- Potential for further Middle East escalation or unexpected hawkish Federal Reserve action raises the risk of broad crypto market liquidations impacting Solana’s liquidity profile.
- Technical outlook signals constrained upside with likely consolidation between $82–$90.75, as trend momentum remains weak and rallies attract selling interest.
Geopolitical shocks and policy risks fueling Solana volatility
During the past week, technical commentary repeatedly attributed significant Solana price volatility to external geopolitical triggers, specifically citing the Binance flash crash incident and heightened tensions involving Iran. The escalation of the Iran conflict and resulting macro uncertainty injected volatility across the broader crypto market, impacting Solana’s price structure during multiple attempted breakouts. A macro risk-off scenario—marked by the threat of Middle East escalation or unexpected hawkish Federal Reserve action—has been identified as a key external threat, with the potential to trigger widespread crypto market liquidations and directly affect Solana’s liquidity and risk premium.
Short-term bullish bias amid weak trend and resistance overhead
SOL is trading above the SMA-20 at $84.89 and the SMA-50 at $85.75, but remains below the SMA-200, which sits much higher at $122.68. The Ichimoku Kijun line on the daily chart is at $83.72, providing immediate support if price reverses. On the momentum side, MACD on D1 is emitting a Buy signal, yet ADX remains weak at 9.57, pointing to limited trend strength. Other daily oscillators, including RSI, CCI, and Stoch RSI, are leaning neutral to modestly bullish, while BBP shows clear buyer dominance intraday and the Awesome Oscillator remains neutral. With SOL trading close to today's high of $86.65 and minimal gap versus the previous close, intraday volatility is low and price action suggests underlying strength after the open.
Sideways movement likely as strong resistance tempers rallies
Over the next five sessions, typical volatility is expected to keep SOL trading in a $82.00 to $90.75 range. Any upward breakout above $91 may stall given the lack of strong momentum, while a bearish move would put $82 to the test as a key support. The most probable baseline scenario is for SOL to trade sideways within the $82–$90 band, with rallies likely facing selling interest amid overhead resistance from higher long-term moving averages.
Earlier, analysts noted that Solana was experiencing sideways movement amid mixed technical signals and constructive developments in institutional adoption. The latest market action reinforces this view, but traders should monitor for unexpected volatility triggered by ongoing geopolitical events, with the $91 level emerging as a near-term ceiling for any bullish breakout attempts.


Latest Solana News


-
 Afghanistan
-
 Albania
-
 Algeria
-
 Angola
-
 Argentina
-
 Armenia
-
 Australia
-
 Austria
-
 Azerbaijan
-
 Bahamas
-
 Bahrain
-
 Bangladesh
-
 Belarus
-
 Belgium
-
 Bolivia
-
 Botswana
-
 Brazil
-
 Brunei
-
 Bulgaria
-
 Cambodia
-
 Cameroon
-
 Canada
-
 Chile
Chile
-
 China
China
-
 Colombia
-
 Congo
Congo
-
 Costa Rica
-
 Cote d'Ivoire
-
 Croatia
-
 Cuba
Cuba
-
 Cyprus
-
 Czechia
-
 DR Congo
-
 Denmark
-
 Dominican Republic
-
 Ecuador
-
 Egypt
Egypt
-
 El Salvador
-
 Estonia
-
 Eswatini
-
 Ethiopia
-
 Finland
-
 France
-
 Georgia
-
 Germany
-
 Ghana
Ghana
-
 Greece
-
 Haiti
Haiti
-
 Hong Kong
-
 Hungary
-
 India
India
-
 Indonesia
-
 Iran, Islamic republic
-
 Iraq
Iraq
-
 Ireland
-
 Israel
-
 Italy
Italy
-
 Jamaica
-
 Japan
Japan
-
 Jordan
-
 Kazakhstan
-
 Kenya
Kenya
-
 Korea
Korea
-
 Kuwait
-
 Kyrgyzstan
-
 Laos
Laos
-
 Latvia
-
 Lebanon
-
 Lesotho
-
 Libya
Libya
-
 Lithuania
-
 Luxembourg
-
 Madagascar
-
 Malaysia
-
 Malta
Malta
-
 Mauritius
-
 Mexico
-
 Moldova
-
 Mongolia
-
 Montenegro
-
 Morocco
-
 Mozambique
-
 Myanmar
-
 Namibia
-
 Nepal
Nepal
-
 Netherlands
-
 New Zealand
-
 Nigeria
-
 North Macedonia
-
 Norway
-
 Oman
Oman
-
 Pakistan
-
 Palestine
-
 Panama
-
 Papua New Guinea
-
 Paraguay
-
 Peru
Peru
-
 Philippines
-
 Poland
-
 Portugal
-
 Puerto Rico
-
 Qatar
Qatar
-
 Reunion
-
 Romania
-
 Rwanda
-
 Saudi Arabia
-
 Serbia
-
 Singapore
-
 Slovakia
-
 Slovenia
-
 Somalia
-
 South Africa
-
 Spain
Spain
-
 Sri Lanka
-
 Sweden
-
 Switzerland
-
 Syria
Syria
-
 Taiwan
-
 Tajikistan
-
 Tanzania
-
 Thailand
-
 Trinidad and Tobago
-
 Tunisia
-
 Turkey
-
 UAE
UAE
-
 Uganda
-
 Ukraine
-
 United Kingdom
-
United States
-
 Uruguay
-
 Uzbekistan
-
 Venezuela
-
 Vietnam
-
 Yemen
Yemen
-
 Zambia
-
 Zimbabwe
- Forex
- Crypto
