
DASH rises as Stochastic RSI issues strong buy signal near key resistance: weekly report

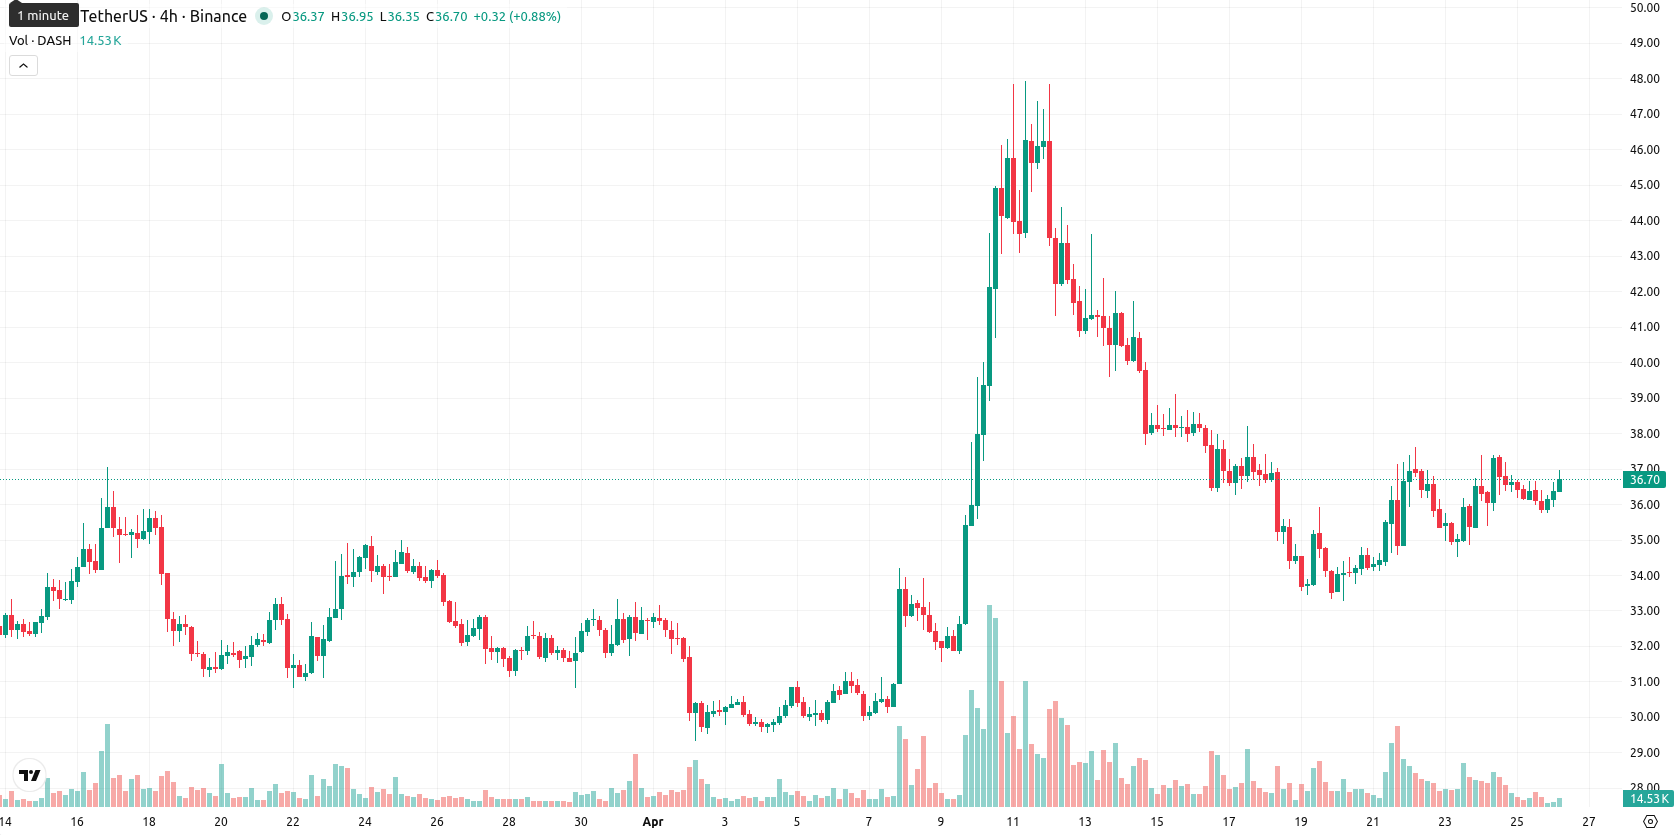
Dash (DASH) is currently trading at $36.63, which is below the weekly MA-20 of $39.74, nearly at the MA-50 of $36.70, and just above the MA-200 at $35.94. Over the past week, Dash gained $2.86, marking an 8.41% advance, and is now positioned in the upper part of its weekly range.
Highlights
- Dash faces medium-term selling pressure as it trades below key moving averages, signaling weak trend momentum.
- Current price action shows a recent 8.41% recovery with Dash now in the upper part of its weekly trading range.
- Upcoming week likely sees Dash rangebound between support at $34.74 and resistance at $36.70, with upside probability at only 25%.
Mixed momentum signals as weekly technicals remain conflicted
From a technical perspective, Dash continues to display medium-term selling pressure as it trades below its weekly MA-20, while lingering near the MA-50 and remaining above the MA-200 suggests underlying long-term support. Weekly volatility is elevated at 13.08%, highlighting strong price swings. The momentum profile is mixed: MACD signals Sell, ADX signals Buy, with further inconsistency from a Sell on RSI, a Strong Buy on Stochastic RSI, and Neutral on CCI; Bull/Bear Power registers as overbought at 0.72, signaling notable buyer strength, but with no decisive bullish trend established. Key dynamic resistance stands at MA-20 ($39.74), while weekly support is observed at $35.94 with resistance near $39.74.
Rangebound trading expected as consolidation signals dominate outlook
For the next 7 days, Dash is likely to move within a range of $34.74 to $36.70, with a higher probability of consolidating or easing back rather than continuing higher. Sideways trading is anticipated between recent support and resistance levels, in line with mixed W1 momentum signals and only one strong buy indicator present. A bullish breakout would require a close above $36.70, potentially opening a higher trading band, while a fall below $34.74 could trigger further declines toward MA-200 support.
Earlier, analysts noted that Dash was exhibiting mixed technical momentum, with bullish signals tempered by overbought risks and resistance overhead. The latest developments reinforce this indecisive outlook, and traders should closely monitor for a confirmed move above $36.70 or below $34.74 as the next directional trigger.


Latest Dash News


-
 Afghanistan
-
 Albania
-
 Algeria
-
 Angola
-
 Argentina
-
 Armenia
-
 Australia
-
 Austria
-
 Azerbaijan
-
 Bahamas
-
 Bahrain
-
 Bangladesh
-
 Belarus
-
 Belgium
-
 Bolivia
-
 Botswana
-
 Brazil
-
 Brunei
-
 Bulgaria
-
 Cambodia
-
 Cameroon
-
 Canada
-
 Chile
Chile
-
 China
China
-
 Colombia
-
 Congo
Congo
-
 Costa Rica
-
 Cote d'Ivoire
-
 Croatia
-
 Cuba
Cuba
-
 Cyprus
-
 Czechia
-
 DR Congo
-
 Denmark
-
 Dominican Republic
-
 Ecuador
-
 Egypt
Egypt
-
 El Salvador
-
 Estonia
-
 Eswatini
-
 Ethiopia
-
 Finland
-
 France
-
 Georgia
-
 Germany
-
 Ghana
Ghana
-
 Greece
-
 Haiti
Haiti
-
 Hong Kong
-
 Hungary
-
 India
India
-
 Indonesia
-
 Iran, Islamic republic
-
 Iraq
Iraq
-
 Ireland
-
 Israel
-
 Italy
Italy
-
 Jamaica
-
 Japan
Japan
-
 Jordan
-
 Kazakhstan
-
 Kenya
Kenya
-
 Korea
Korea
-
 Kuwait
-
 Kyrgyzstan
-
 Laos
Laos
-
 Latvia
-
 Lebanon
-
 Lesotho
-
 Libya
Libya
-
 Lithuania
-
 Luxembourg
-
 Madagascar
-
 Malaysia
-
 Malta
Malta
-
 Mauritius
-
 Mexico
-
 Moldova
-
 Mongolia
-
 Montenegro
-
 Morocco
-
 Mozambique
-
 Myanmar
-
 Namibia
-
 Nepal
Nepal
-
 Netherlands
-
 New Zealand
-
 Nigeria
-
 North Macedonia
-
 Norway
-
 Oman
Oman
-
 Pakistan
-
 Palestine
-
 Panama
-
 Papua New Guinea
-
 Paraguay
-
 Peru
Peru
-
 Philippines
-
 Poland
-
 Portugal
-
 Puerto Rico
-
 Qatar
Qatar
-
 Reunion
-
 Romania
-
 Rwanda
-
 Saudi Arabia
-
 Serbia
-
 Singapore
-
 Slovakia
-
 Slovenia
-
 Somalia
-
 South Africa
-
 Spain
Spain
-
 Sri Lanka
-
 Sweden
-
 Switzerland
-
 Syria
Syria
-
 Taiwan
-
 Tajikistan
-
 Tanzania
-
 Thailand
-
 Trinidad and Tobago
-
 Tunisia
-
 Turkey
-
 UAE
UAE
-
 Uganda
-
 Ukraine
-
 United Kingdom
-
United States
-
 Uruguay
-
 Uzbekistan
-
 Venezuela
-
 Vietnam
-
 Yemen
Yemen
-
 Zambia
-
 Zimbabwe
- Forex
- Crypto
