
HBAR edges lower as price remains below all major moving averages: weekly outlook

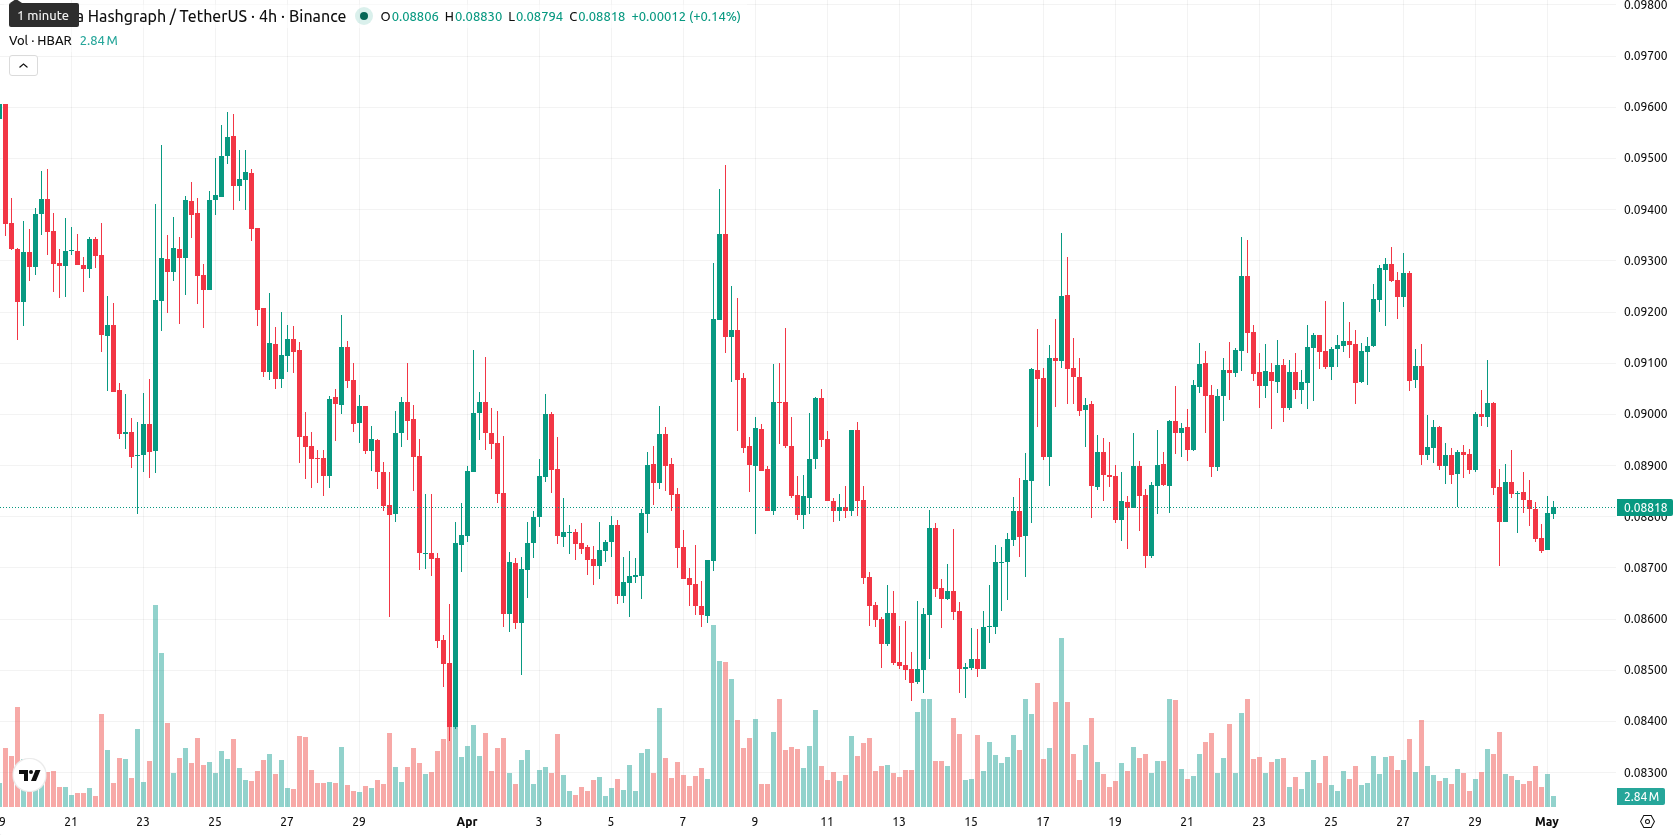
Hedera (HBAR) is currently trading at $0.0882, positioned below its weekly MA-20 ($0.0984), MA-50 ($0.1569), and MA-200 ($0.1101). Over the last week, the asset declined by $0.0025, or 2.77%, closing at the bottom of its range and remaining under pressure from dynamic resistance levels.
Highlights
- HBAR remains under bearish pressure, trading below major moving averages and encountering strong resistance above current levels.
- Momentum indicators confirm persistent selling dominance, with the asset nearing oversold territory but no signs of reversal emerging.
- Projected price range for the week is $0.0836–$0.0933, with further downside probable unless a close above $0.093 occurs.
Ecosystem expansion and partnerships support sentiment despite price drop
Hedera announced that Accenture has joined its governing Council, enhancing its role as an enterprise-focused distributed ledger network. The network's ecosystem expanded further with the recent conclusion of the 2025 Hedera Africa Hackathon, which drew over 13,000 developers and distributed a $1 million prize pool. The formation of an Investment Committee by The Hashgraph Association and new partnerships, including with the Nairobi Securities Exchange, also highlight ongoing strategic growth.
Bearish technicals persist as HBAR closes week at multi-month lows
Weekly technical indicators for HBAR reinforce a bearish outlook as the price remains firmly below all major weekly moving averages (MA-20, MA-50, MA-200). Strong selling pressure is confirmed by negative MACD (Strong Sell), a low RSI at 34.91, a bearish Commodity Channel Index (–72.32), and Stochastic RSI also signaling sell. Weekly volatility reached 7.24%, with the asset closing at weekly lows. Bear and Bull Power indicators confirm sellers are in control, and no bullish divergence is evident in oscillators.
Range-bound bias for coming week as upside signals remain weak
For the next 7 days, HBAR is expected to trade within a $0.0836 to $0.0933 range. Weekly indicators suggest a high likelihood of continued consolidation or further decline, with under 20% probability of a sustained upward move as no key indicators provide a buy signal. The base scenario is for HBAR to remain range-bound between $0.084 and $0.093, while a weekly close above $0.093 would indicate a potential bullish reversal. Conversely, a break below $0.084 may open the path for a deeper pullback toward lower support levels.
Previously, it was reported that Fitch affirmed the strength of New Jersey Infrastructure Bank's environmental infrastructure bonds based on the program's resilient structure and high-quality loan pool. While that review focused on credit stability in traditional assets, the current technical landscape for Hedera signals a consolidation phase with downside risk, making a sustained move above $0.093 a key indicator to watch for signs of a potential bullish reversal.


-
 Afghanistan
-
 Albania
-
 Algeria
-
 Angola
-
 Argentina
-
 Armenia
-
 Australia
-
 Austria
-
 Azerbaijan
-
 Bahamas
-
 Bahrain
-
 Bangladesh
-
 Belarus
-
 Belgium
-
 Bolivia
-
 Botswana
-
 Brazil
-
 Brunei
-
 Bulgaria
-
 Cambodia
-
 Cameroon
-
 Canada
-
 Chile
Chile
-
 China
China
-
 Colombia
-
 Congo
Congo
-
 Costa Rica
-
 Cote d'Ivoire
-
 Croatia
-
 Cuba
Cuba
-
 Cyprus
-
 Czechia
-
 DR Congo
-
 Denmark
-
 Dominican Republic
-
 Ecuador
-
 Egypt
Egypt
-
 El Salvador
-
 Estonia
-
 Eswatini
-
 Ethiopia
-
 Finland
-
 France
-
 Georgia
-
 Germany
-
 Ghana
Ghana
-
 Greece
-
 Haiti
Haiti
-
 Hong Kong
-
 Hungary
-
 India
India
-
 Indonesia
-
 Iran, Islamic republic
-
 Iraq
Iraq
-
 Ireland
-
 Israel
-
 Italy
Italy
-
 Jamaica
-
 Japan
Japan
-
 Jordan
-
 Kazakhstan
-
 Kenya
Kenya
-
 Korea
Korea
-
 Kuwait
-
 Kyrgyzstan
-
 Laos
Laos
-
 Latvia
-
 Lebanon
-
 Lesotho
-
 Libya
Libya
-
 Lithuania
-
 Luxembourg
-
 Madagascar
-
 Malaysia
-
 Malta
Malta
-
 Mauritius
-
 Mexico
-
 Moldova
-
 Mongolia
-
 Montenegro
-
 Morocco
-
 Mozambique
-
 Myanmar
-
 Namibia
-
 Nepal
Nepal
-
 Netherlands
-
 New Zealand
-
 Nigeria
-
 North Macedonia
-
 Norway
-
 Oman
Oman
-
 Pakistan
-
 Palestine
-
 Panama
-
 Papua New Guinea
-
 Paraguay
-
 Peru
Peru
-
 Philippines
-
 Poland
-
 Portugal
-
 Puerto Rico
-
 Qatar
Qatar
-
 Reunion
-
 Romania
-
 Rwanda
-
 Saudi Arabia
-
 Serbia
-
 Singapore
-
 Slovakia
-
 Slovenia
-
 Somalia
-
 South Africa
-
 Spain
Spain
-
 Sri Lanka
-
 Sweden
-
 Switzerland
-
 Syria
Syria
-
 Taiwan
-
 Tajikistan
-
 Tanzania
-
 Thailand
-
 Trinidad and Tobago
-
 Tunisia
-
 Turkey
-
 UAE
UAE
-
 Uganda
-
 Ukraine
-
 United Kingdom
-
United States
-
 Uruguay
-
 Uzbekistan
-
 Venezuela
-
 Vietnam
-
 Yemen
Yemen
-
 Zambia
-
 Zimbabwe
- Forex
- Crypto
