
Ethereum price prediction: $2,340 resistance in focus? ETH trades flat

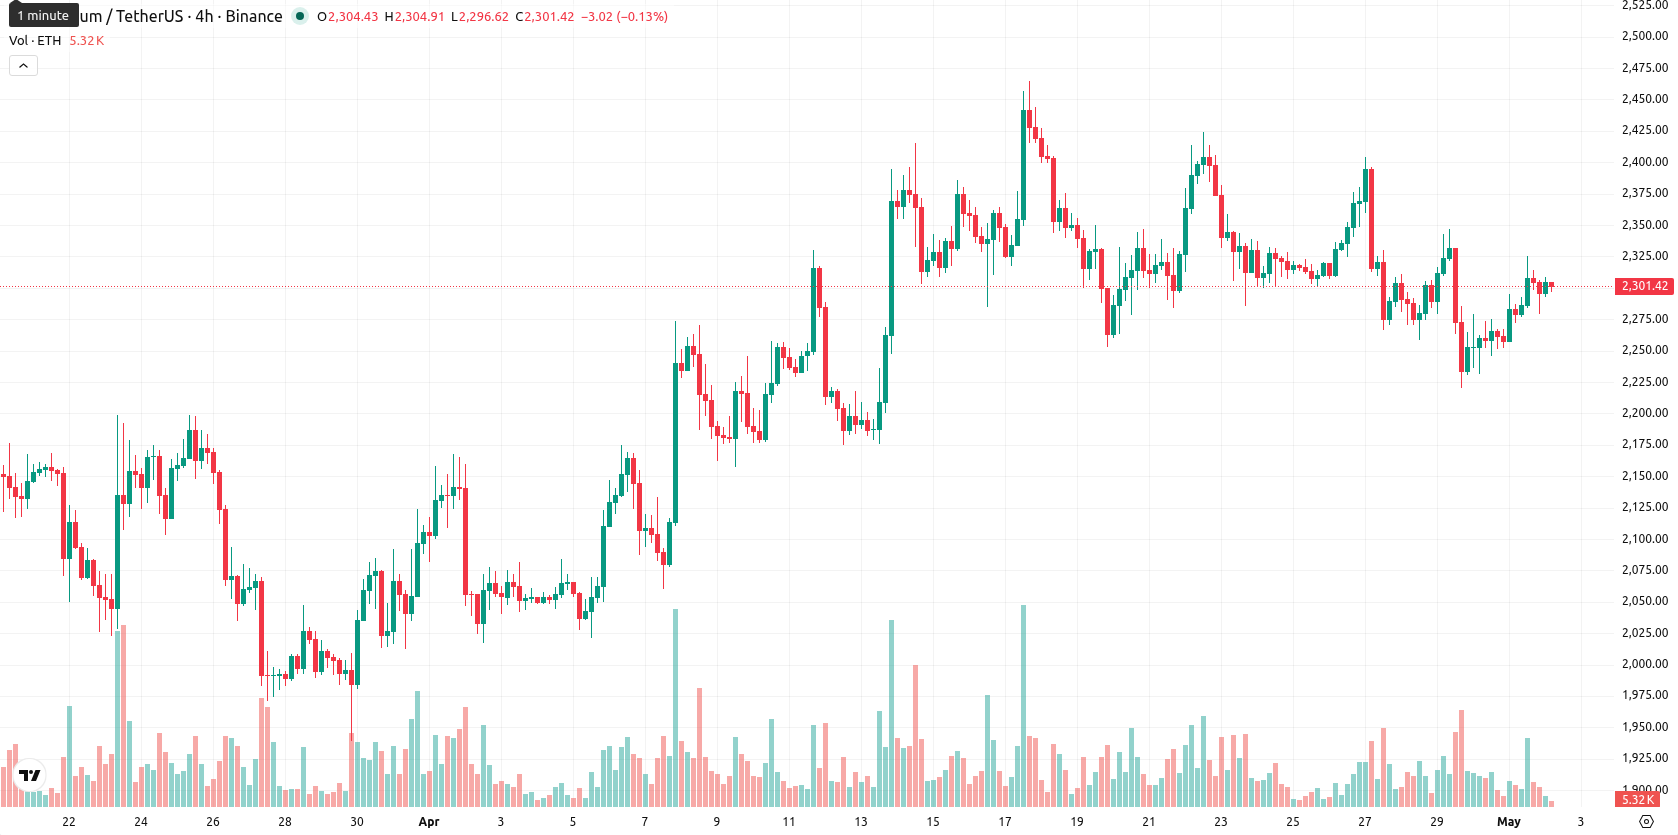
Ethereum (ETH) is trading at $2,300.03, posting a daily gain of 0.70%. The asset is currently below its key short-term moving average but remains above its intermediate moving average, highlighting mixed momentum with moderate intraday volatility.
Highlights
- The Federal Reserve's sustained pause on rates and ongoing inflationary pressure continue to create cautious liquidity conditions for Ethereum and risk assets.
- Anticipation of Congressional debate on the Clarity Act in May injects fresh regulatory uncertainty, keeping Ethereum investors vigilant about possible compliance shifts.
- ETH trades in a consolidation range between $2,270 and $2,340, with technical indicators signaling weak trend strength, overbought conditions, and a higher probability of downside.
Policy caution and regulatory uncertainty heighten risk aversion
The Federal Reserve's decision to hold benchmark interest rates steady at 3.5%–3.75% for a third consecutive meeting is creating policy caution, with persistent inflation and energy price volatility shaping liquidity conditions for risk assets like Ethereum. Looking ahead, the planned Congressional debate over the Clarity Act in May introduces regulatory uncertainty, leaving the market alert to possible shifts in the digital asset landscape that could affect Ethereum's regulatory standing. Additionally, a recent surge in crypto hacks, largely attributed to North Korean groups, has heightened risk aversion and weighed on overall sentiment for Ethereum investors.
Conflicting indicators as ETH tests support amid weak trend strength
On the technical side, ETH is below the MA-20 ($2,318.33), above the MA-50 ($2,207.12), and well below the MA-200 ($2,735.55), with the Ichimoku Kijun line providing immediate support at $2,262.57. The MACD on the daily chart is in a strong buy position, while the ADX remains neutral, indicating limited trend strength. RSI is neutral at 51.70 with a buy tilt, Stoch RSI is a strong buy at 29.75, and CCI is weak at –57.94 signaling a sell. BBP readings indicate an overbought setup, and the Awesome Oscillator remains neutral, all reflecting mixed signals and a tentative technical outlook.
Downside favored as technicals limit probability of breakout
Over the next five trading days, ETH is expected to trade within a typical volatility band between $2,270 and $2,340. The probability of a price increase is estimated at less than 20%, with a downside move more likely given current averages and technical signals. The base case is for price to consolidate above $2,262 and below $2,340. A bullish break would require sustained price action above $2,340, while a loss of $2,262 support would likely trigger further downside toward lower weekly closes.
Earlier, analysts noted that Ethereum’s leveraged positioning made the market vulnerable to sharper downside moves if support failed, with significant liquidation risks influencing short-term price action. Amid persistent regulatory and macroeconomic uncertainty, traders should monitor for unexpected volatility spikes and be prepared for potential liquidity-driven moves outside the projected consolidation range.


Latest Ethereum News


-
 Afghanistan
-
 Albania
-
 Algeria
-
 Angola
-
 Argentina
-
 Armenia
-
 Australia
-
 Austria
-
 Azerbaijan
-
 Bahamas
-
 Bahrain
-
 Bangladesh
-
 Belarus
-
 Belgium
-
 Bolivia
-
 Botswana
-
 Brazil
-
 Brunei
-
 Bulgaria
-
 Cambodia
-
 Cameroon
-
 Canada
-
 Chile
Chile
-
 China
China
-
 Colombia
-
 Congo
Congo
-
 Costa Rica
-
 Cote d'Ivoire
-
 Croatia
-
 Cuba
Cuba
-
 Cyprus
-
 Czechia
-
 DR Congo
-
 Denmark
-
 Dominican Republic
-
 Ecuador
-
 Egypt
Egypt
-
 El Salvador
-
 Estonia
-
 Eswatini
-
 Ethiopia
-
 Finland
-
 France
-
 Georgia
-
 Germany
-
 Ghana
Ghana
-
 Greece
-
 Haiti
Haiti
-
 Hong Kong
-
 Hungary
-
 India
India
-
 Indonesia
-
 Iran, Islamic republic
-
 Iraq
Iraq
-
 Ireland
-
 Israel
-
 Italy
Italy
-
 Jamaica
-
 Japan
Japan
-
 Jordan
-
 Kazakhstan
-
 Kenya
Kenya
-
 Korea
Korea
-
 Kuwait
-
 Kyrgyzstan
-
 Laos
Laos
-
 Latvia
-
 Lebanon
-
 Lesotho
-
 Libya
Libya
-
 Lithuania
-
 Luxembourg
-
 Madagascar
-
 Malaysia
-
 Malta
Malta
-
 Mauritius
-
 Mexico
-
 Moldova
-
 Mongolia
-
 Montenegro
-
 Morocco
-
 Mozambique
-
 Myanmar
-
 Namibia
-
 Nepal
Nepal
-
 Netherlands
-
 New Zealand
-
 Nigeria
-
 North Macedonia
-
 Norway
-
 Oman
Oman
-
 Pakistan
-
 Palestine
-
 Panama
-
 Papua New Guinea
-
 Paraguay
-
 Peru
Peru
-
 Philippines
-
 Poland
-
 Portugal
-
 Puerto Rico
-
 Qatar
Qatar
-
 Reunion
-
 Romania
-
 Rwanda
-
 Saudi Arabia
-
 Serbia
-
 Singapore
-
 Slovakia
-
 Slovenia
-
 Somalia
-
 South Africa
-
 Spain
Spain
-
 Sri Lanka
-
 Sweden
-
 Switzerland
-
 Syria
Syria
-
 Taiwan
-
 Tajikistan
-
 Tanzania
-
 Thailand
-
 Trinidad and Tobago
-
 Tunisia
-
 Turkey
-
 UAE
UAE
-
 Uganda
-
 Ukraine
-
 United Kingdom
-
United States
-
 Uruguay
-
 Uzbekistan
-
 Venezuela
-
 Vietnam
-
 Yemen
Yemen
-
 Zambia
-
 Zimbabwe
- Forex
- Crypto
