
Walrus climbs as sustained strength emerges far below its long-term average

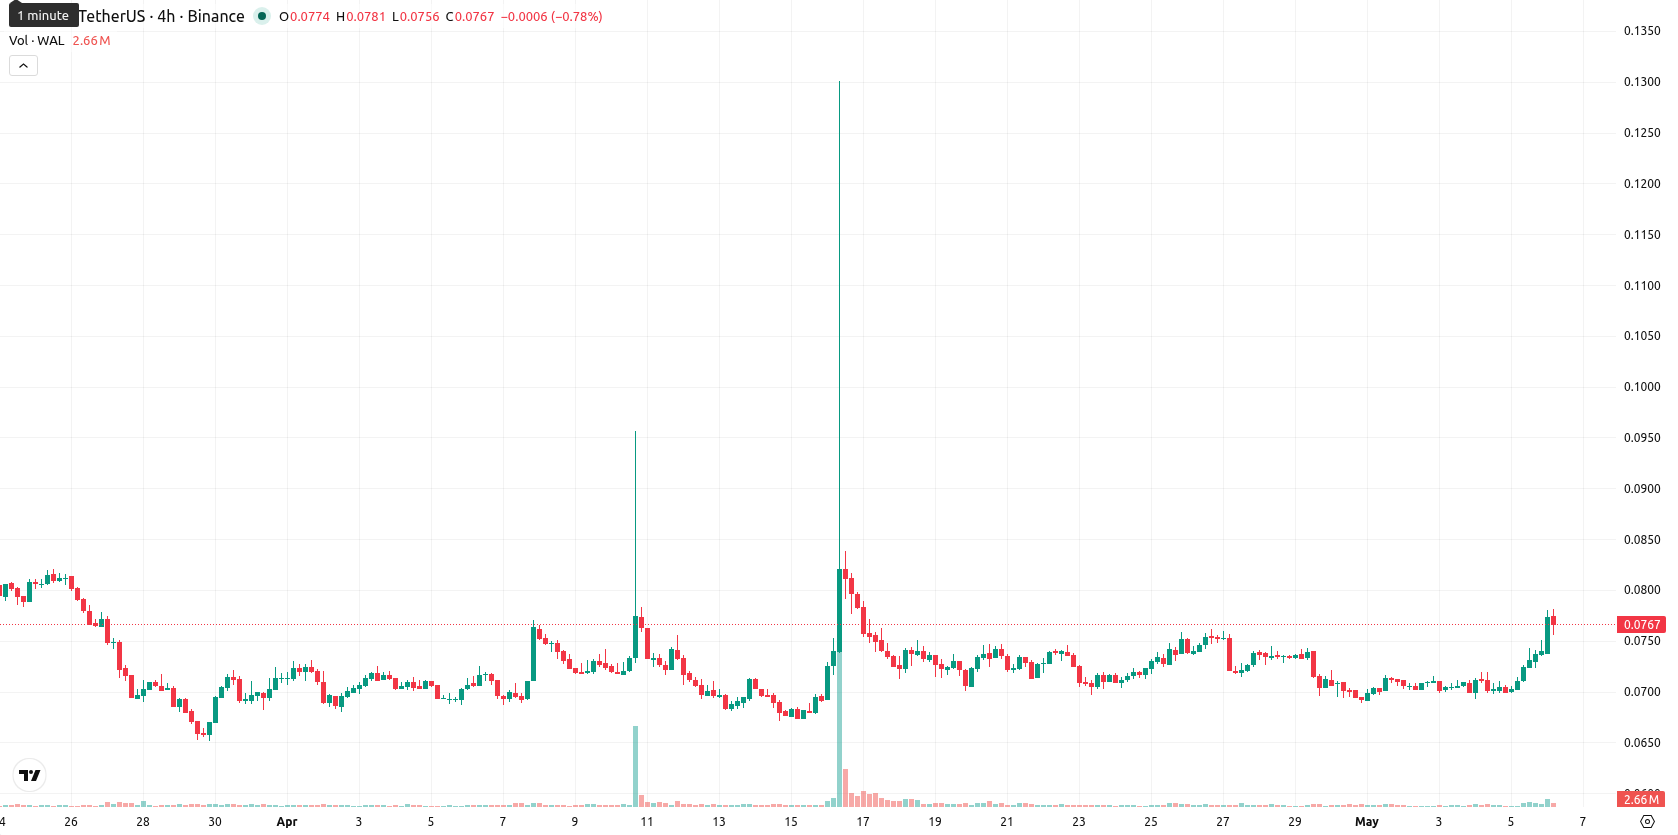
Walrus (WAL) is trading at $0.0764 after a sharp 7.67% daily rise, sitting above its key moving averages. The price is positioned above short- and medium-term trend lines, reflecting ongoing positive momentum in the near term.
Highlights
- WAL shows short- and medium-term bullish momentum but remains under long-term bearish pressure as it trades below major moving averages.
- Momentum indicators are mixed, with some overbought signals and diverging trend strength, suggesting limited upside potential in the near term.
- Expect WAL to fluctuate between $0.069 and $0.092 over the next five days, with a breakout above $0.095 or below $0.073 signaling directional conviction.
Divergent momentum as short-term strength meets overhead resistance
WAL is currently trading above the SMA-20 ($0.0726) and SMA-50 ($0.0734) while remaining well below the SMA-200 ($0.1237). The Ichimoku Kijun (D1) stands at $0.0949, creating a clear overhead resistance level. The MACD signals strong sell pressure, in contrast to the ADX which sits firmly in buy territory. The RSI is at 52.79 and the CCI is near neutral, both indicating a balanced momentum that is neither overbought nor oversold. Meanwhile, the Stoch RSI is deep in overbought territory, and the BBP highlights intraday buyer dominance. The Awesome Oscillator remains neutral, adding to the divergence among momentum indicators.
Limited upside as volatility bands point to pullback risk
For the next five trading days, WAL is expected to fluctuate within a volatility band of $0.069 to $0.092 based on current price action. The probability of a further price increase is assessed as very low (below 20%), suggesting a higher risk of pullback. The baseline case is for WAL to remain within a sideways channel near current support and resistance levels. A breakout above $0.095 would trigger a move higher, while a sustained drop below $0.073 could open the way to further declines into the lower end of the recent range.
Earlier, analysts noted that Walrus continued to experience medium- and long-term bearish pressure despite intermittent short-term rallies. The current setup maintains this cautious outlook, with traders advised to monitor for a decisive breakout above $0.095 as a potential catalyst for a bullish reversal.


Latest Walrus News


-
 Afghanistan
-
 Albania
-
 Algeria
-
 Angola
-
 Argentina
-
 Armenia
-
 Australia
-
 Austria
-
 Azerbaijan
-
 Bahamas
-
 Bahrain
-
 Bangladesh
-
 Belarus
-
 Belgium
-
 Bolivia
-
 Botswana
-
 Brazil
-
 Brunei
-
 Bulgaria
-
 Cambodia
-
 Cameroon
-
 Canada
-
 Chile
Chile
-
 China
China
-
 Colombia
-
 Congo
Congo
-
 Costa Rica
-
 Cote d'Ivoire
-
 Croatia
-
 Cuba
Cuba
-
 Cyprus
-
 Czechia
-
 DR Congo
-
 Denmark
-
 Dominican Republic
-
 Ecuador
-
 Egypt
Egypt
-
 El Salvador
-
 Estonia
-
 Eswatini
-
 Ethiopia
-
 Finland
-
 France
-
 Georgia
-
 Germany
-
 Ghana
Ghana
-
 Greece
-
 Haiti
Haiti
-
 Hong Kong
-
 Hungary
-
 India
India
-
 Indonesia
-
 Iran, Islamic republic
-
 Iraq
Iraq
-
 Ireland
-
 Israel
-
 Italy
Italy
-
 Jamaica
-
 Japan
Japan
-
 Jordan
-
 Kazakhstan
-
 Kenya
Kenya
-
 Korea
Korea
-
 Kuwait
-
 Kyrgyzstan
-
 Laos
Laos
-
 Latvia
-
 Lebanon
-
 Lesotho
-
 Libya
Libya
-
 Lithuania
-
 Luxembourg
-
 Madagascar
-
 Malaysia
-
 Malta
Malta
-
 Mauritius
-
 Mexico
-
 Moldova
-
 Mongolia
-
 Montenegro
-
 Morocco
-
 Mozambique
-
 Myanmar
-
 Namibia
-
 Nepal
Nepal
-
 Netherlands
-
 New Zealand
-
 Nigeria
-
 North Macedonia
-
 Norway
-
 Oman
Oman
-
 Pakistan
-
 Palestine
-
 Panama
-
 Papua New Guinea
-
 Paraguay
-
 Peru
Peru
-
 Philippines
-
 Poland
-
 Portugal
-
 Puerto Rico
-
 Qatar
Qatar
-
 Reunion
-
 Romania
-
 Rwanda
-
 Saudi Arabia
-
 Serbia
-
 Singapore
-
 Slovakia
-
 Slovenia
-
 Somalia
-
 South Africa
-
 Spain
Spain
-
 Sri Lanka
-
 Sweden
-
 Switzerland
-
 Syria
Syria
-
 Taiwan
-
 Tajikistan
-
 Tanzania
-
 Thailand
-
 Trinidad and Tobago
-
 Tunisia
-
 Turkey
-
 UAE
UAE
-
 Uganda
-
 Ukraine
-
 United Kingdom
-
United States
-
 Uruguay
-
 Uzbekistan
-
 Venezuela
-
 Vietnam
-
 Yemen
Yemen
-
 Zambia
-
 Zimbabwe
- Forex
- Crypto
