
Solana price prediction: Can $85.00 support hold as SOL drops 1.82%?

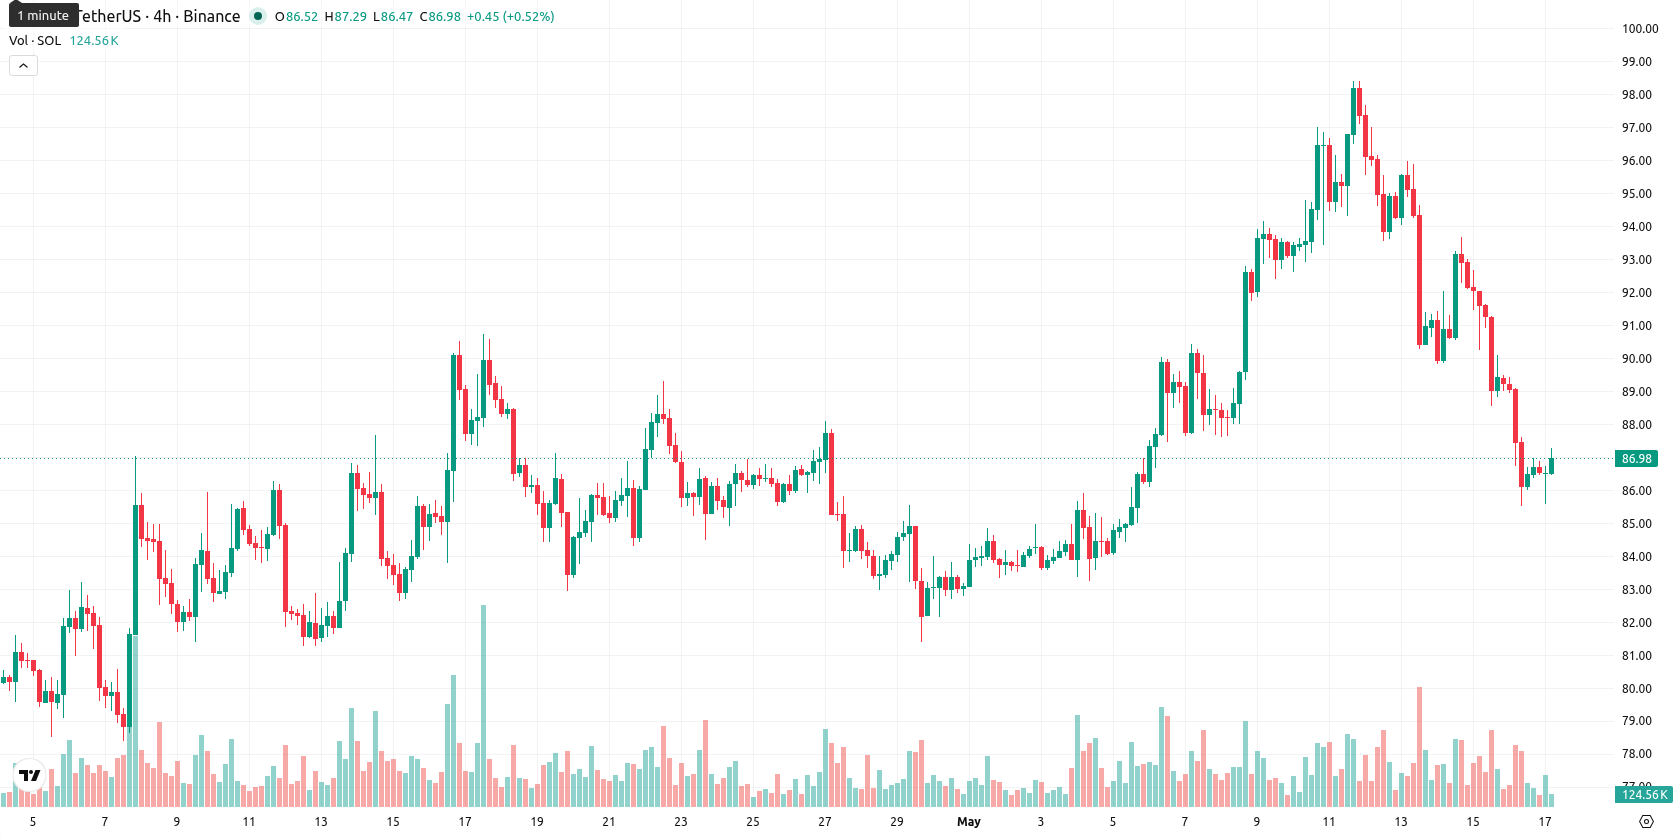
Solana (SOL) is trading at $86.91, marking a daily drop of 1.82%. The asset currently sits below its key moving averages.
Highlights
- Morgan Stanley boosted Solana exposure by allocating $29.9 million via Bitwise's ETF and filing to launch its own Solana Trust, signaling increased institutional access.
- Weekly inflows into U.S. spot Solana ETFs reached $58 million, lifting cumulative net flows to $1.13 billion and signaling sustained regulated investment demand.
- Solana trades under key moving averages with seller dominance; near-term price is likely to consolidate between $85.00 and $90.00 amid weak upward momentum.
Institutional inflows and new trust filings as selling pressure persists
Morgan Stanley has increased its exposure to Solana by allocating $29.9 million through Bitwise's staking ETF and has filed with the SEC to establish its own Solana Trust, expanding institutional access channels for the token. Weekly flows into U.S. spot Solana ETFs recorded $58 million, raising total net flows to roughly $1.13 billion and combined AUM to about $1.05 billion, reflecting ongoing capital allocation toward regulated Solana investment products. Solana also activated a quantum signature scheme on mainnet, reducing compute resource requirements and potentially improving network efficiency, though price action has remained under broader selling pressure.
Weak bullish signals as long-term resistance overshadows momentum
Technically, SOL faces short-term and medium-term resistance, with the MA-20 at $88.37 and the Ichimoku Kijun at $89.91, while immediate support is provided by the MA-50 at $85.78. The MA-200 lingers far above at $110.85, highlighting a bearish long-term structure. On the daily chart, the MACD indicates possible bullish reversal potential, yet trend strength remains weak as shown by the ADX at 12.72. RSI is at 45.71 and CCI is near neutral, while both Stoch RSI and BBP suggest oversold conditions and a seller-dominated session, especially after a slight opening gap down and closing in the lower third of the day’s price range.
Rangebound outlook as oversold signals limit chances of breakout
For the next five trading days, SOL is projected to fluctuate within a typical volatility band near the current level, ranging from $85.00 to $90.00. The likelihood of a breakout to the upside is considered low (below 20%), so a further decline or continuation of sideways movement remains more probable. A baseline scenario envisions price consolidation within this corridor as oversold signals slow momentum. A bullish scenario would require a decisive move above the immediate resistance at $89.91, while a break below $85.00 could lead to a retest of medium-term support.
Earlier, analysts noted that Solana was caught in a period of sideways trading, weighed down by mixed technicals and ongoing regulatory uncertainty despite signs of institutional interest. With the latest moves by Morgan Stanley and rising ETF inflows adding momentum to institutional participation, investors should now monitor whether persistent selling pressure around $89.91 resistance gives way to fresh buying or triggers further downside toward medium-term support.


Latest Solana News


-
 Afghanistan
-
 Albania
-
 Algeria
-
 Angola
-
 Argentina
-
 Armenia
-
 Australia
-
 Austria
-
 Azerbaijan
-
 Bahamas
-
 Bahrain
-
 Bangladesh
-
 Belarus
-
 Belgium
-
 Bolivia
-
 Botswana
-
 Brazil
-
 Brunei
-
 Bulgaria
-
 Cambodia
-
 Cameroon
-
 Canada
-
 Chile
Chile
-
 China
China
-
 Colombia
-
 Congo
Congo
-
 Costa Rica
-
 Cote d'Ivoire
-
 Croatia
-
 Cuba
Cuba
-
 Cyprus
-
 Czechia
-
 DR Congo
-
 Denmark
-
 Dominican Republic
-
 Ecuador
-
 Egypt
Egypt
-
 El Salvador
-
 Estonia
-
 Eswatini
-
 Ethiopia
-
 Finland
-
 France
-
 Georgia
-
 Germany
-
 Ghana
Ghana
-
 Greece
-
 Haiti
Haiti
-
 Hong Kong
-
 Hungary
-
 India
India
-
 Indonesia
-
 Iran, Islamic republic
-
 Iraq
Iraq
-
 Ireland
-
 Israel
-
 Italy
Italy
-
 Jamaica
-
 Japan
Japan
-
 Jordan
-
 Kazakhstan
-
 Kenya
Kenya
-
 Korea
Korea
-
 Kuwait
-
 Kyrgyzstan
-
 Laos
Laos
-
 Latvia
-
 Lebanon
-
 Lesotho
-
 Libya
Libya
-
 Lithuania
-
 Luxembourg
-
 Madagascar
-
 Malaysia
-
 Malta
Malta
-
 Mauritius
-
 Mexico
-
 Moldova
-
 Mongolia
-
 Montenegro
-
 Morocco
-
 Mozambique
-
 Myanmar
-
 Namibia
-
 Nepal
Nepal
-
 Netherlands
-
 New Zealand
-
 Nigeria
-
 North Macedonia
-
 Norway
-
 Oman
Oman
-
 Pakistan
-
 Palestine
-
 Panama
-
 Papua New Guinea
-
 Paraguay
-
 Peru
Peru
-
 Philippines
-
 Poland
-
 Portugal
-
 Puerto Rico
-
 Qatar
Qatar
-
 Reunion
-
 Romania
-
 Rwanda
-
 Saudi Arabia
-
 Serbia
-
 Singapore
-
 Slovakia
-
 Slovenia
-
 Somalia
-
 South Africa
-
 Spain
Spain
-
 Sri Lanka
-
 Sweden
-
 Switzerland
-
 Syria
Syria
-
 Taiwan
-
 Tajikistan
-
 Tanzania
-
 Thailand
-
 Trinidad and Tobago
-
 Tunisia
-
 Turkey
-
 UAE
UAE
-
 Uganda
-
 Ukraine
-
 United Kingdom
-
United States
-
 Uruguay
-
 Uzbekistan
-
 Venezuela
-
 Vietnam
-
 Yemen
Yemen
-
 Zambia
-
 Zimbabwe
- Forex
- Crypto
