
Solana price prediction: $89.90 resistance in focus? SOL trades up

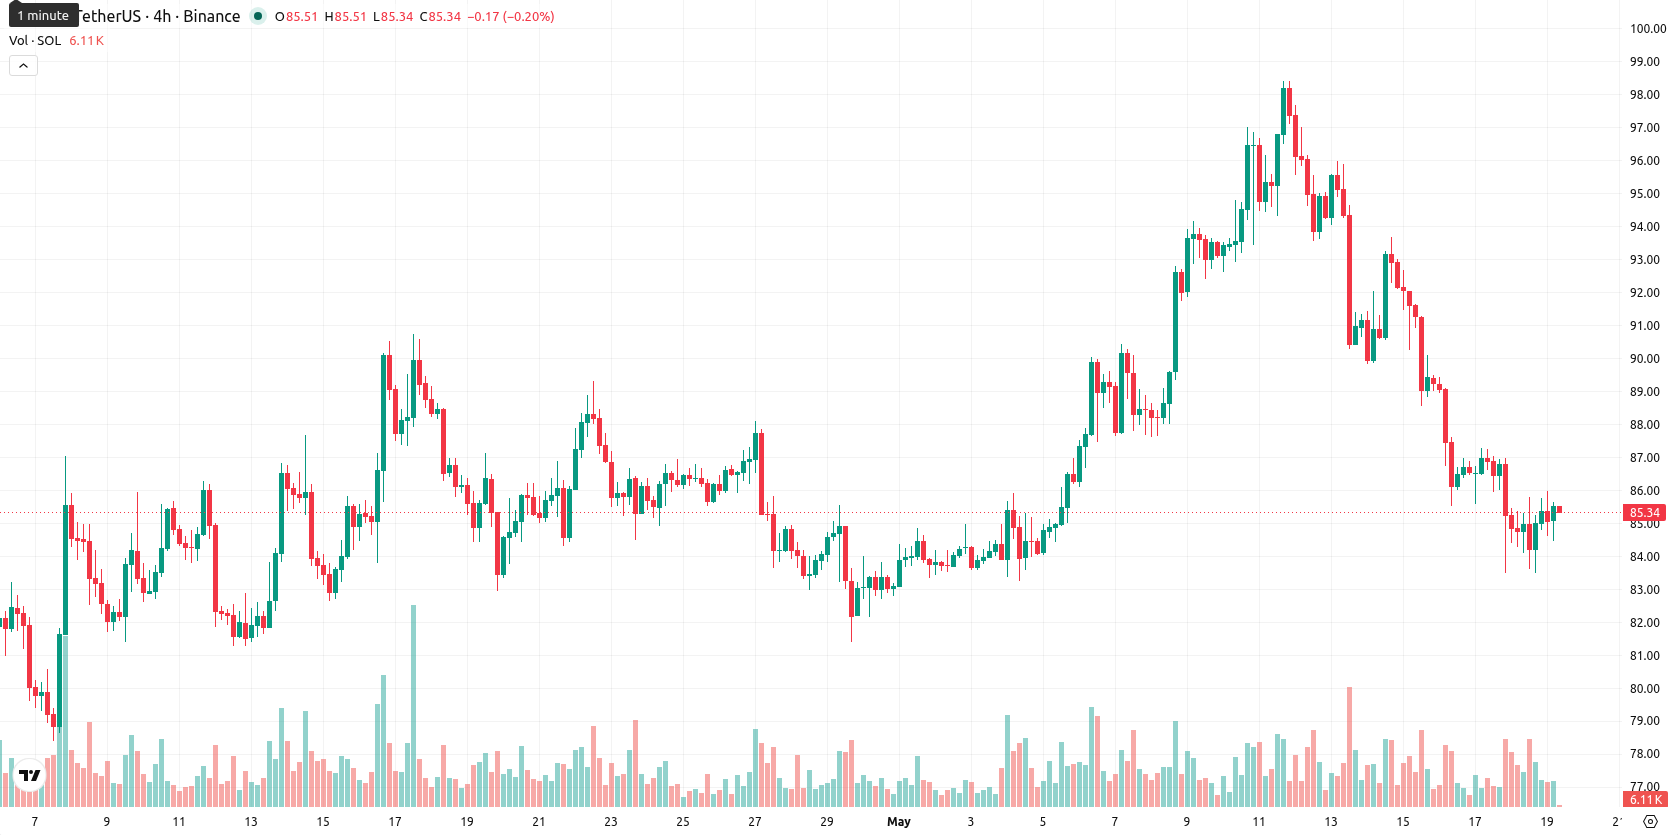
Solana (SOL) is trading at $85.54 today, up 1.00% from the previous session. The price sits below its key short-term averages and is roughly unchanged from the medium-term trend, reflecting modest positive momentum within a wider bearish structure.
Highlights
- Goldman Sachs has fully liquidated its Solana ETF positions, removing significant institutional demand and dampening market liquidity for Solana products.
- Persistent regulatory concerns, including the SEC's view of Solana as a potential unregistered security, constrain ETF eligibility and discourage additional institutional inflows.
- SOL trades below major moving averages with short- and medium-term bearish pressure, and is expected to remain within an $83.80 to $87.15 range, with limited upside probability.
Liquidity positioned lower as Goldman exit and SEC pressure persist
Goldman Sachs' recent liquidation of all Solana ETF holdings, as reported in its SEC Form 13F filing for the first quarter of 2026, removes a major source of institutional demand and directly impacts market liquidity for Solana-linked products. Ongoing regulatory uncertainty persists, with the SEC maintaining its classification of Solana as a potential unregistered security, which restricts ETF eligibility and limits further institutional participation. Simultaneously, more than $700 million in crypto liquidations, including Solana, reflect the spillover from broader market turmoil and heighten overall risk aversion in the ecosystem.
Mixed signals as short-term resistance and mild oversold conditions align
The $85.54 level places SOL just below the 20-day simple moving average ($88.45), directly at the 50-day SMA ($85.92), and well beneath the 200-day SMA ($109.81). Immediate resistance is marked by the Ichimoku Kijun at $89.91. Daily indicators are mixed: the MACD on the D1 chart signals a strong buy, but the Average Directional Index remains neutral, suggesting a lack of conviction. The RSI reads 43.78 and the CCI registers -61.48, both hinting at mild oversold conditions, supported by oversold readings in Stoch RSI and BBP. Recent price action shows a moderate climb with a small opening gap and trading near intraday highs, though oscillator divergence calls for caution.
Downside risk elevated as low breakout odds restrict upside
Over the next five sessions, typical volatility should keep SOL within a range of $83.80 to $87.15. The probability of a sustained move higher is very low—less than 20%—implying the risk of a downside break is much greater. Baseline scenario favors continued sideways trading near current levels. Should SOL close above $89.90, a test of resistance is likely. Conversely, a move below $83.80 could trigger further downside if selling accelerates.
Earlier, analysts noted that Solana faced ongoing regulatory pressure and limited upside potential despite pockets of resilient network activity and institutional interest. The latest developments reinforce the asset's vulnerability to both macro-driven liquidations and institutional outflows, making a sustained move above $89.90 a critical inflection point for traders monitoring breakout or breakdown scenarios.


Latest Solana News


-
 Afghanistan
-
 Albania
-
 Algeria
-
 Angola
-
 Argentina
-
 Armenia
-
 Australia
-
 Austria
-
 Azerbaijan
-
 Bahamas
-
 Bahrain
-
 Bangladesh
-
 Belarus
-
 Belgium
-
 Bolivia
-
 Botswana
-
 Brazil
-
 Brunei
-
 Bulgaria
-
 Cambodia
-
 Cameroon
-
 Canada
-
 Chile
Chile
-
 China
China
-
 Colombia
-
 Congo
Congo
-
 Costa Rica
-
 Cote d'Ivoire
-
 Croatia
-
 Cuba
Cuba
-
 Cyprus
-
 Czechia
-
 DR Congo
-
 Denmark
-
 Dominican Republic
-
 Ecuador
-
 Egypt
Egypt
-
 El Salvador
-
 Estonia
-
 Eswatini
-
 Ethiopia
-
 Finland
-
 France
-
 Georgia
-
 Germany
-
 Ghana
Ghana
-
 Greece
-
 Haiti
Haiti
-
 Hong Kong
-
 Hungary
-
 India
India
-
 Indonesia
-
 Iran, Islamic republic
-
 Iraq
Iraq
-
 Ireland
-
 Israel
-
 Italy
Italy
-
 Jamaica
-
 Japan
Japan
-
 Jordan
-
 Kazakhstan
-
 Kenya
Kenya
-
 Korea
Korea
-
 Kuwait
-
 Kyrgyzstan
-
 Laos
Laos
-
 Latvia
-
 Lebanon
-
 Lesotho
-
 Libya
Libya
-
 Lithuania
-
 Luxembourg
-
 Madagascar
-
 Malaysia
-
 Malta
Malta
-
 Mauritius
-
 Mexico
-
 Moldova
-
 Mongolia
-
 Montenegro
-
 Morocco
-
 Mozambique
-
 Myanmar
-
 Namibia
-
 Nepal
Nepal
-
 Netherlands
-
 New Zealand
-
 Nigeria
-
 North Macedonia
-
 Norway
-
 Oman
Oman
-
 Pakistan
-
 Palestine
-
 Panama
-
 Papua New Guinea
-
 Paraguay
-
 Peru
Peru
-
 Philippines
-
 Poland
-
 Portugal
-
 Puerto Rico
-
 Qatar
Qatar
-
 Reunion
-
 Romania
-
 Rwanda
-
 Saudi Arabia
-
 Serbia
-
 Singapore
-
 Slovakia
-
 Slovenia
-
 Somalia
-
 South Africa
-
 Spain
Spain
-
 Sri Lanka
-
 Sweden
-
 Switzerland
-
 Syria
Syria
-
 Taiwan
-
 Tajikistan
-
 Tanzania
-
 Thailand
-
 Trinidad and Tobago
-
 Tunisia
-
 Turkey
-
 UAE
UAE
-
 Uganda
-
 Ukraine
-
 United Kingdom
-
United States
-
 Uruguay
-
 Uzbekistan
-
 Venezuela
-
 Vietnam
-
 Yemen
Yemen
-
 Zambia
-
 Zimbabwe
- Forex
- Crypto
