
Aave slides as bearish momentum holds price below key moving averages: weekly outlook

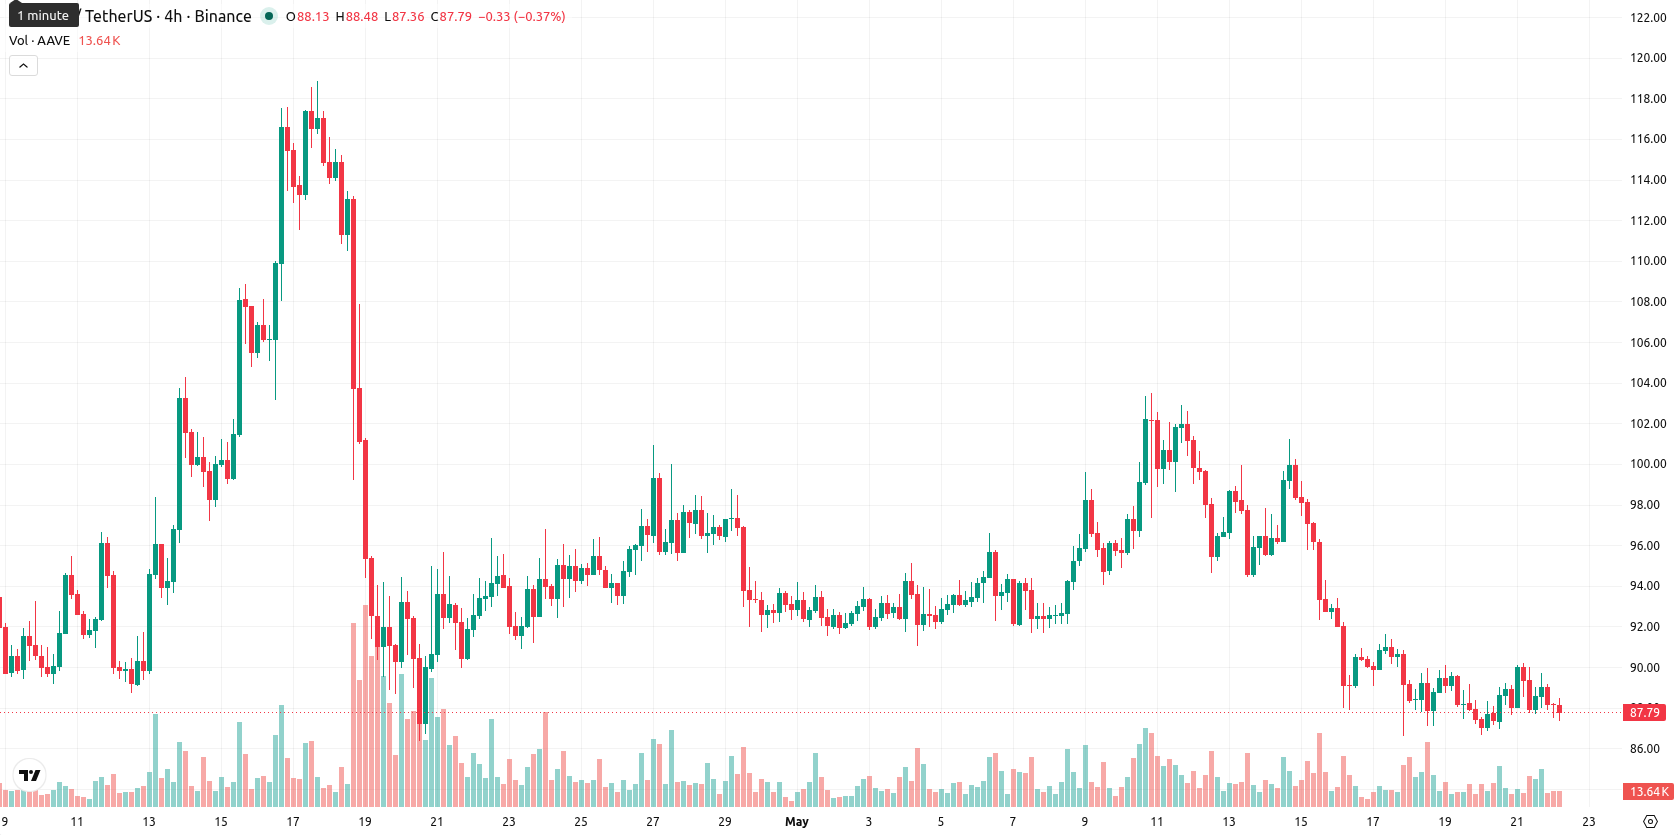
Aave (AAVE) is trading at $87.81, standing well below the weekly MA-20 at $112.27, MA-50 at $195.61, and MA-200 at $137.36. Over the last week, AAVE declined $9.04, down 9.34%, and is pinned to the bottom of its recent weekly range, emphasizing ongoing bearish pressure below key moving averages.
Highlights
- AAVE continues to trade below major moving averages, indicating persistent medium- and long-term bearish momentum.
- Weekly technical indicators confirm overwhelming seller dominance as AAVE closes down 9.34% at the bottom of its weekly range.
- AAVE is expected to consolidate between $79.00 and $96.50, with a strong likelihood of further declines if support breaks.
Institutional adoption accelerates as ecosystem engagement rises over the week
Kraken's Layer 2 blockchain, Ink, has introduced Tydro, a custom lending platform powered by a white-label implementation of Aave V3, demonstrating the protocol's expanding role in DeFi infrastructure and institutional adoption. Recent data shows that active loans and protocol usage have been climbing weekly following the launch of Aave V4, highlighting increased engagement within the Aave ecosystem. In addition, MoonPay’s new institutional platform now facilitates DeFi lending access for banks and regulated financial firms using Aave technology.
Downside momentum persists as technical signals confirm extended weakness
Weekly technical momentum for AAVE remains bearish, with the asset trading below all major weekly moving averages. Strong downside signals from the MACD and ADX confirm ongoing negative momentum, while the RSI and CCI both signal oversold or near-oversold conditions. Weekly volatility stands at 7.85%, Bull/Bear Power remains negative, and the Awesome Oscillator indicates a neutral stance despite clear seller control. Immediate weekly support is at $79.00, with resistance near $96.50 and dynamic resistance at the MA-20 ($112.27).
Further consolidation near support expected as breakout risk remains muted
In the next 7 days, AAVE is expected to stay in a broad consolidation range between $79.00 and $96.50, according to weekly indicators. The probability of a rebound above resistance is very low, with nearly all signals pointing to further downside or sideways movement. The baseline scenario is continued consolidation near support; a bearish break below $79.00 would likely open the way to new lows. Conversely, a bullish surprise above $96.50 appears unlikely unless otherwise signaled by a dramatic shift in weekly momentum.
Earlier, analysts noted that Aave was experiencing sustained bearish momentum amid negative technical signals and unresolved legal factors. The current environment reinforces this outlook, with persistent downside pressure and rising trading activity suggesting that a decisive break below the key $79.00 support could escalate further declines in the near term.


-
 Afghanistan
-
 Albania
-
 Algeria
-
 Angola
-
 Argentina
-
 Armenia
-
 Australia
-
 Austria
-
 Azerbaijan
-
 Bahamas
-
 Bahrain
-
 Bangladesh
-
 Belarus
-
 Belgium
-
 Bolivia
-
 Botswana
-
 Brazil
-
 Brunei
-
 Bulgaria
-
 Cambodia
-
 Cameroon
-
 Canada
-
 Chile
Chile
-
 China
China
-
 Colombia
-
 Congo
Congo
-
 Costa Rica
-
 Cote d'Ivoire
-
 Croatia
-
 Cuba
Cuba
-
 Cyprus
-
 Czechia
-
 DR Congo
-
 Denmark
-
 Dominican Republic
-
 Ecuador
-
 Egypt
Egypt
-
 El Salvador
-
 Estonia
-
 Eswatini
-
 Ethiopia
-
 Finland
-
 France
-
 Georgia
-
 Germany
-
 Ghana
Ghana
-
 Greece
-
 Haiti
Haiti
-
 Hong Kong
-
 Hungary
-
 India
India
-
 Indonesia
-
 Iran, Islamic republic
-
 Iraq
Iraq
-
 Ireland
-
 Israel
-
 Italy
Italy
-
 Jamaica
-
 Japan
Japan
-
 Jordan
-
 Kazakhstan
-
 Kenya
Kenya
-
 Korea
Korea
-
 Kuwait
-
 Kyrgyzstan
-
 Laos
Laos
-
 Latvia
-
 Lebanon
-
 Lesotho
-
 Libya
Libya
-
 Lithuania
-
 Luxembourg
-
 Madagascar
-
 Malaysia
-
 Malta
Malta
-
 Mauritius
-
 Mexico
-
 Moldova
-
 Mongolia
-
 Montenegro
-
 Morocco
-
 Mozambique
-
 Myanmar
-
 Namibia
-
 Nepal
Nepal
-
 Netherlands
-
 New Zealand
-
 Nigeria
-
 North Macedonia
-
 Norway
-
 Oman
Oman
-
 Pakistan
-
 Palestine
-
 Panama
-
 Papua New Guinea
-
 Paraguay
-
 Peru
Peru
-
 Philippines
-
 Poland
-
 Portugal
-
 Puerto Rico
-
 Qatar
Qatar
-
 Reunion
-
 Romania
-
 Rwanda
-
 Saudi Arabia
-
 Serbia
-
 Singapore
-
 Slovakia
-
 Slovenia
-
 Somalia
-
 South Africa
-
 Spain
Spain
-
 Sri Lanka
-
 Sweden
-
 Switzerland
-
 Syria
Syria
-
 Taiwan
-
 Tajikistan
-
 Tanzania
-
 Thailand
-
 Trinidad and Tobago
-
 Tunisia
-
 Turkey
-
 UAE
UAE
-
 Uganda
-
 Ukraine
-
 United Kingdom
-
United States
-
 Uruguay
-
 Uzbekistan
-
 Venezuela
-
 Vietnam
-
 Yemen
Yemen
-
 Zambia
-
 Zimbabwe
- Forex
- Crypto
