
Dash price prediction: Will the $40–$48 range hold as DASH drops sharply?

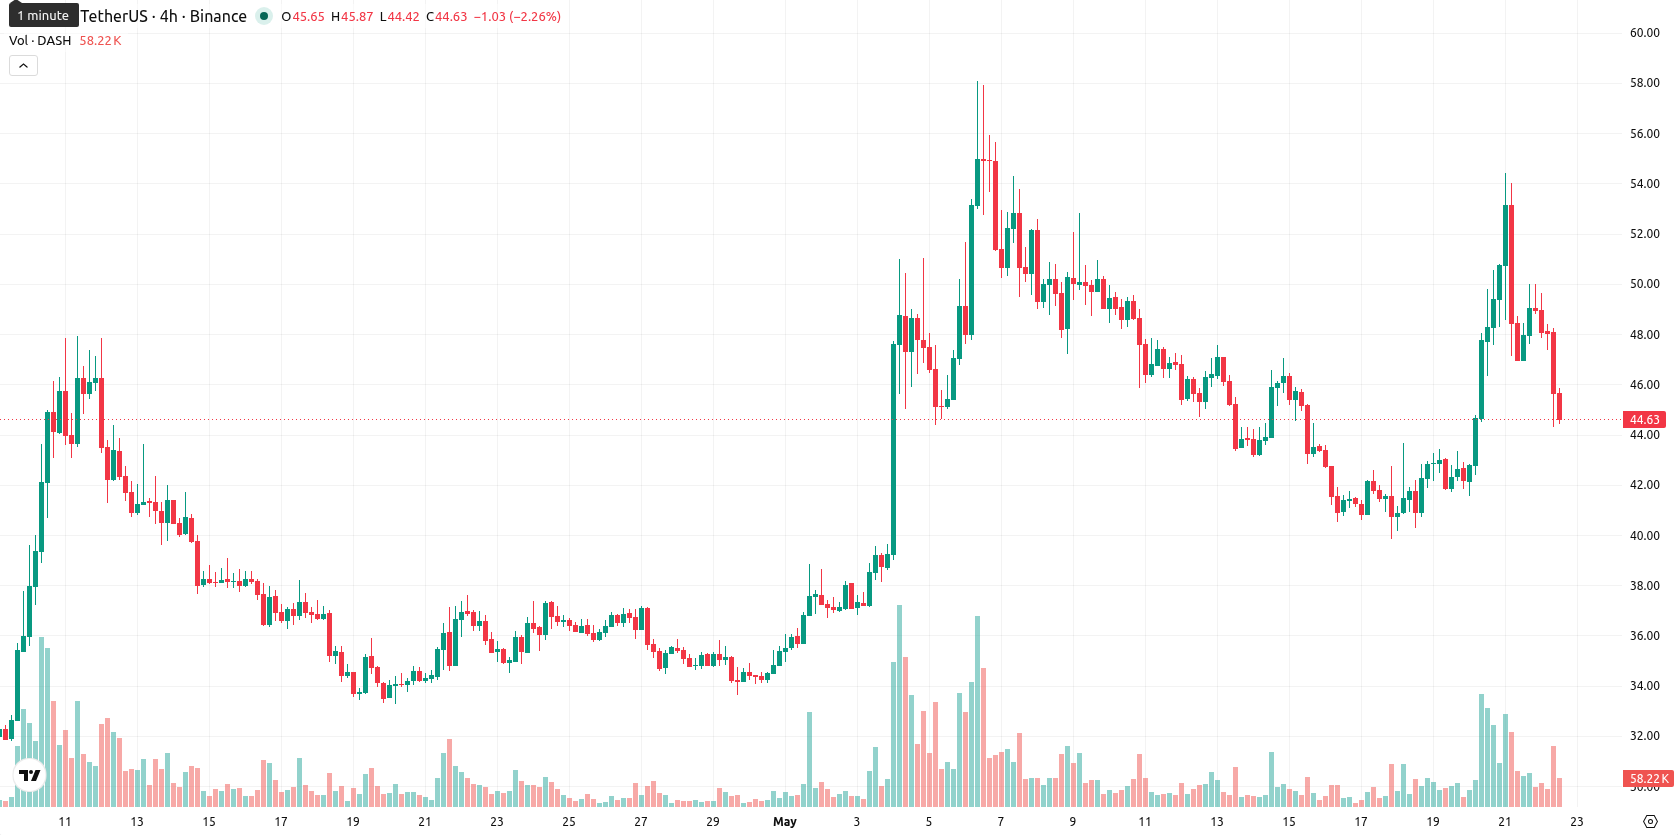
Dash (DASH) is trading at $44.44 in today's session, down 7.80% from the prior close. The price currently sits below its key short-term moving averages, with momentum fading modestly compared to recent levels.
Highlights
- Dash experienced heightened volatility driven by significant short liquidations and shifting institutional sentiment, boosting transaction volumes yet keeping price under selling pressure.
- Liquidation events forced mechanical repositioning, while institutional signals shaped broader market tone, amplifying recent price moves.
- Technically, Dash faces near-term weakness with consolidation likely between $44.00 and $46.00; a break below $44.00 risks a fall to $40.00–$42.00, while upside toward $48.00 remains probable.
Short liquidations and institutions drive volatile flows under selling pressure
Recent market volatility affecting Dash has been attributed to notable short liquidations and institutional signals, as disclosed on May 21, 2026. These factors typically result in shifts in trading flows, with liquidation events prompting mechanical adjustments and institutional participation shaping broader market sentiment. The resulting activity has contributed to increased transaction volumes, though price action has remained under broader selling pressure.
Mixed momentum as daily bullish signals clash with strong intraday selling
Technically, DASH trades below the SMA-20 at $45.85 and sits just under the Ichimoku Kijun at $45.87, with immediate resistance at these levels. The SMA-50 at $39.84 remains supportive beneath, while SMA-200 at $46.50 marks a major upper threshold; price opened the session at $48.96 with a minor gap up but quickly reversed, touching a session low of $44.31. On the daily chart, MACD and ADX indicate an upward bias, yet RSI at 60.42 and CCI at 87.35 reflect the absence of extreme conditions. BBP (Bull/Bear Power) on D1 signals overbought danger, though intraday BBP and oscillators (M5 to H1) confirm seller dominance, while the Awesome Oscillator shows a buy bias that is not fully consistent with recent declines. These mixed signals highlight the divergence between multi-day bullish momentum and strong intraday selling pressure, placing focus on near-term support levels.
Range-bound consolidation expected as support and resistance define outlook
In the short term, DASH is expected to oscillate within a typical volatility band of $40.00 to $48.00, influenced by current market dynamics. The baseline scenario calls for consolidation between $44.00 and $46.00. Should DASH break above $46.00, further upside toward $48.00 is possible, while a loss of support under $44.00 could see price revisiting the $40.00 to $42.00 zone.
Previously it was reported that Dash's outlook was broadly bullish, supported by strong market momentum and increased participation from both institutional and retail players. However, the present pullback and heightened volatility introduce a new phase of two-way risk, making the $44.00 to $46.00 consolidation range a critical area for traders to monitor for potential breakout or further downside.


-
 Afghanistan
-
 Albania
-
 Algeria
-
 Angola
-
 Argentina
-
 Armenia
-
 Australia
-
 Austria
-
 Azerbaijan
-
 Bahamas
-
 Bahrain
-
 Bangladesh
-
 Belarus
-
 Belgium
-
 Bolivia
-
 Botswana
-
 Brazil
-
 Brunei
-
 Bulgaria
-
 Cambodia
-
 Cameroon
-
 Canada
-
 Chile
Chile
-
 China
China
-
 Colombia
-
 Congo
Congo
-
 Costa Rica
-
 Cote d'Ivoire
-
 Croatia
-
 Cuba
Cuba
-
 Cyprus
-
 Czechia
-
 DR Congo
-
 Denmark
-
 Dominican Republic
-
 Ecuador
-
 Egypt
Egypt
-
 El Salvador
-
 Estonia
-
 Eswatini
-
 Ethiopia
-
 Finland
-
 France
-
 Georgia
-
 Germany
-
 Ghana
Ghana
-
 Greece
-
 Haiti
Haiti
-
 Hong Kong
-
 Hungary
-
 India
India
-
 Indonesia
-
 Iran, Islamic republic
-
 Iraq
Iraq
-
 Ireland
-
 Israel
-
 Italy
Italy
-
 Jamaica
-
 Japan
Japan
-
 Jordan
-
 Kazakhstan
-
 Kenya
Kenya
-
 Korea
Korea
-
 Kuwait
-
 Kyrgyzstan
-
 Laos
Laos
-
 Latvia
-
 Lebanon
-
 Lesotho
-
 Libya
Libya
-
 Lithuania
-
 Luxembourg
-
 Madagascar
-
 Malaysia
-
 Malta
Malta
-
 Mauritius
-
 Mexico
-
 Moldova
-
 Mongolia
-
 Montenegro
-
 Morocco
-
 Mozambique
-
 Myanmar
-
 Namibia
-
 Nepal
Nepal
-
 Netherlands
-
 New Zealand
-
 Nigeria
-
 North Macedonia
-
 Norway
-
 Oman
Oman
-
 Pakistan
-
 Palestine
-
 Panama
-
 Papua New Guinea
-
 Paraguay
-
 Peru
Peru
-
 Philippines
-
 Poland
-
 Portugal
-
 Puerto Rico
-
 Qatar
Qatar
-
 Reunion
-
 Romania
-
 Rwanda
-
 Saudi Arabia
-
 Serbia
-
 Singapore
-
 Slovakia
-
 Slovenia
-
 Somalia
-
 South Africa
-
 Spain
Spain
-
 Sri Lanka
-
 Sweden
-
 Switzerland
-
 Syria
Syria
-
 Taiwan
-
 Tajikistan
-
 Tanzania
-
 Thailand
-
 Trinidad and Tobago
-
 Tunisia
-
 Turkey
-
 UAE
UAE
-
 Uganda
-
 Ukraine
-
 United Kingdom
-
United States
-
 Uruguay
-
 Uzbekistan
-
 Venezuela
-
 Vietnam
-
 Yemen
Yemen
-
 Zambia
-
 Zimbabwe
- Forex
- Crypto
