
Ethereum price prediction: Will $2,055 support hold as ETH trades flat?

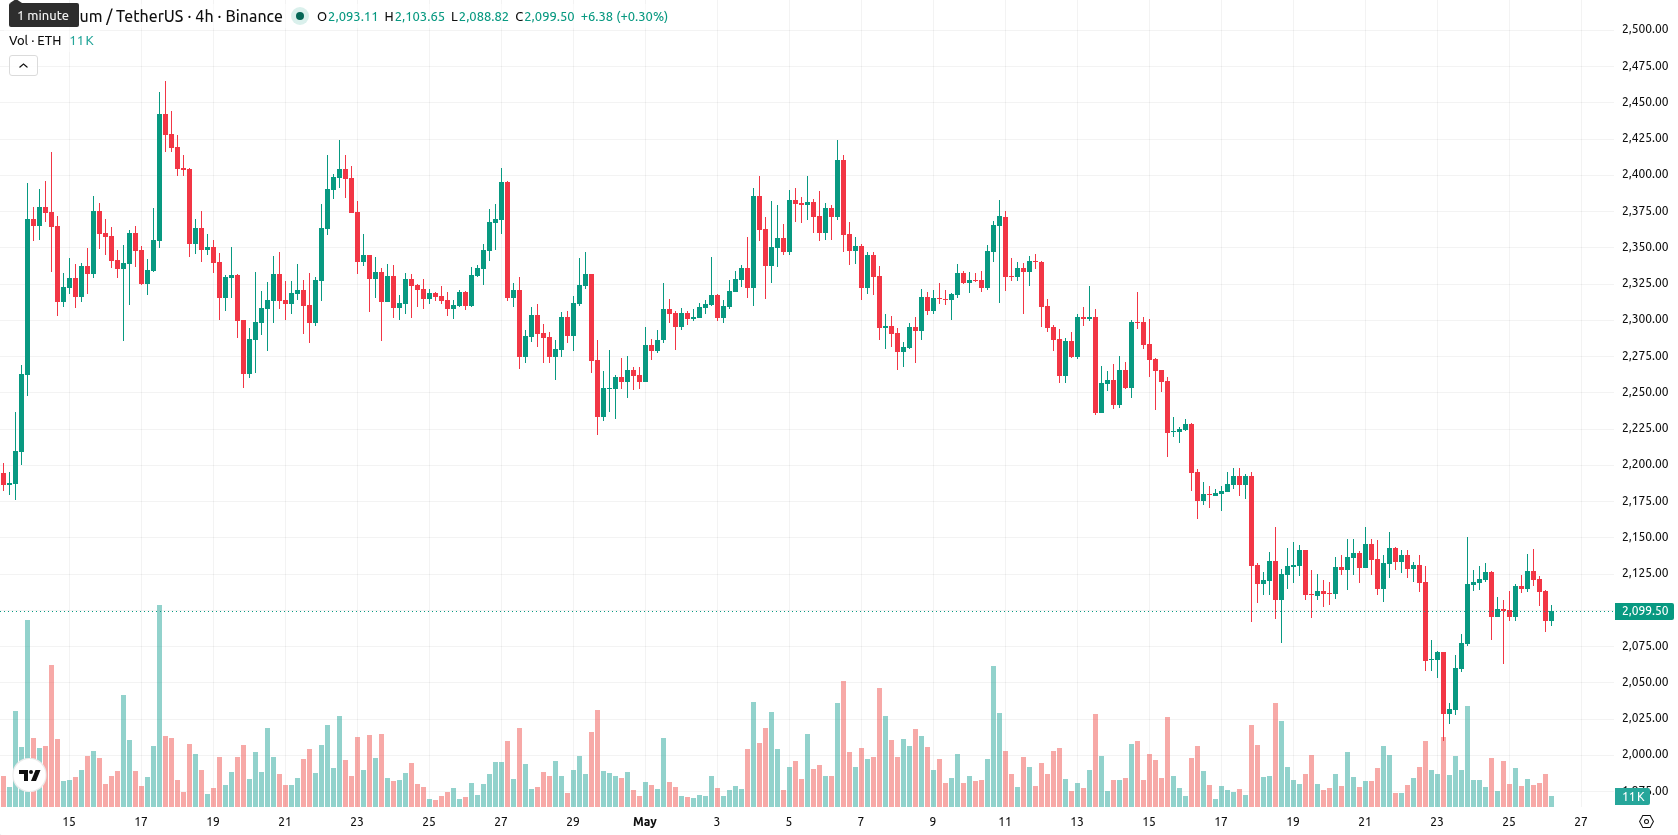
Ethereum (ETH) is trading at $2,099.53, reflecting a daily decline of 0.09%. The asset remains below its key moving averages, suggesting ongoing pressure from sellers.
Highlights
- The Ethereum Foundation reduced direct ETH selling, prioritizing long-term protocol development and treasury flexibility without adding immediate supply pressure.
- Spot Ethereum ETFs in the U.S. saw over $215 million in weekly net outflows, indicating ongoing institutional withdrawal amid broader market selling.
- ETH trades below key technical resistance with bearish momentum confirmed by multiple indicators, projecting a likely consolidation between $2,055 and $2,120 over the next week.
Institutional withdrawals and treasury moves deepen as selling pressure persists
The Ethereum Foundation has taken steps to reduce its ETH sales from treasury holdings, a move aimed at sustaining the protocol's long-term development while placing emphasis on decentralization, privacy, and security. This follows the recent unstaking of 21,270 ETH, valued at approximately $50 million, from Lido for treasury reorganization purposes rather than immediate sale, providing the foundation with greater flexibility but no direct supply increase at present. Meanwhile, U.S. spot Ethereum ETFs recorded aggregate net outflows of over $215 million in the past week, marking a continued withdrawal of institutional capital, and a presale investor moved a significant volume of ETH after years of dormancy, highlighting potential shifts in long-term holder behavior. Collectively, these developments have occurred as broader selling pressure remains the dominant force in the market.
Downside momentum confirmed as ETH breaks below major technical supports
Technically, ETH is trading below the SMA-20 at $2,211.86, SMA-50 at $2,264.29, and SMA-200 at $2,541.83, with the Ichimoku Kijun level at $2,216.52 forming immediate resistance. Momentum indicators on the daily timeframe are weak, with MACD and ADX both reflecting a lack of bullish momentum; RSI stands at 38.72, CCI at –72.72, and BBP at –12.19, all indicative of underlying bearish momentum and oversold conditions. Stoch RSI and the Awesome Oscillator are neutral, while most momentum and oscillator signals confirm continued downside movement with little evidence of intraday recovery.
Limited upside odds as bearish bias guides short-term trading range
Over the next five trading days, ETH is expected to trade within a typical volatility band of $2,055 to $2,120. The probability of a price increase remains very low, with less than a 20% chance, while further downside is more likely. The dominant scenario is for sideways movement within this corridor as bearish momentum prevails. Should ETH rise above immediate resistance at $2,216, a bullish reversal could begin, while a sustained move below $2,055 would suggest a continuation of recent losses.
Earlier, analysts noted that Ethereum was under persistent bearish pressure due to institutional outflows and heightened concerns around decentralization. The continuation of net ETF outflows and treasury-related movements underscore enduring seller dominance, making sustained price action above immediate resistance at $2,216 a critical signal for any potential bullish shift in the near term.


-
 Afghanistan
-
 Albania
-
 Algeria
-
 Angola
-
 Argentina
-
 Armenia
-
 Australia
-
 Austria
-
 Azerbaijan
-
 Bahamas
-
 Bahrain
-
 Bangladesh
-
 Belarus
-
 Belgium
-
 Bolivia
-
 Botswana
-
 Brazil
-
 Brunei
-
 Bulgaria
-
 Cambodia
-
 Cameroon
-
 Canada
-
 Chile
Chile
-
 China
China
-
 Colombia
-
 Congo
Congo
-
 Costa Rica
-
 Cote d'Ivoire
-
 Croatia
-
 Cuba
Cuba
-
 Cyprus
-
 Czechia
-
 DR Congo
-
 Denmark
-
 Dominican Republic
-
 Ecuador
-
 Egypt
Egypt
-
 El Salvador
-
 Estonia
-
 Eswatini
-
 Ethiopia
-
 Finland
-
 France
-
 Georgia
-
 Germany
-
 Ghana
Ghana
-
 Greece
-
 Haiti
Haiti
-
 Hong Kong
-
 Hungary
-
 India
India
-
 Indonesia
-
 Iran, Islamic republic
-
 Iraq
Iraq
-
 Ireland
-
 Israel
-
 Italy
Italy
-
 Jamaica
-
 Japan
Japan
-
 Jordan
-
 Kazakhstan
-
 Kenya
Kenya
-
 Korea
Korea
-
 Kuwait
-
 Kyrgyzstan
-
 Laos
Laos
-
 Latvia
-
 Lebanon
-
 Lesotho
-
 Libya
Libya
-
 Lithuania
-
 Luxembourg
-
 Madagascar
-
 Malaysia
-
 Malta
Malta
-
 Mauritius
-
 Mexico
-
 Moldova
-
 Mongolia
-
 Montenegro
-
 Morocco
-
 Mozambique
-
 Myanmar
-
 Namibia
-
 Nepal
Nepal
-
 Netherlands
-
 New Zealand
-
 Nigeria
-
 North Macedonia
-
 Norway
-
 Oman
Oman
-
 Pakistan
-
 Palestine
-
 Panama
-
 Papua New Guinea
-
 Paraguay
-
 Peru
Peru
-
 Philippines
-
 Poland
-
 Portugal
-
 Puerto Rico
-
 Qatar
Qatar
-
 Reunion
-
 Romania
-
 Rwanda
-
 Saudi Arabia
-
 Serbia
-
 Singapore
-
 Slovakia
-
 Slovenia
-
 Somalia
-
 South Africa
-
 Spain
Spain
-
 Sri Lanka
-
 Sweden
-
 Switzerland
-
 Syria
Syria
-
 Taiwan
-
 Tajikistan
-
 Tanzania
-
 Thailand
-
 Trinidad and Tobago
-
 Tunisia
-
 Turkey
-
 UAE
UAE
-
 Uganda
-
 Ukraine
-
 United Kingdom
-
United States
-
 Uruguay
-
 Uzbekistan
-
 Venezuela
-
 Vietnam
-
 Yemen
Yemen
-
 Zambia
-
 Zimbabwe
- Forex
- Crypto
