
Short-term sideways outlook caps Pendle's drop below $2.02 resistance

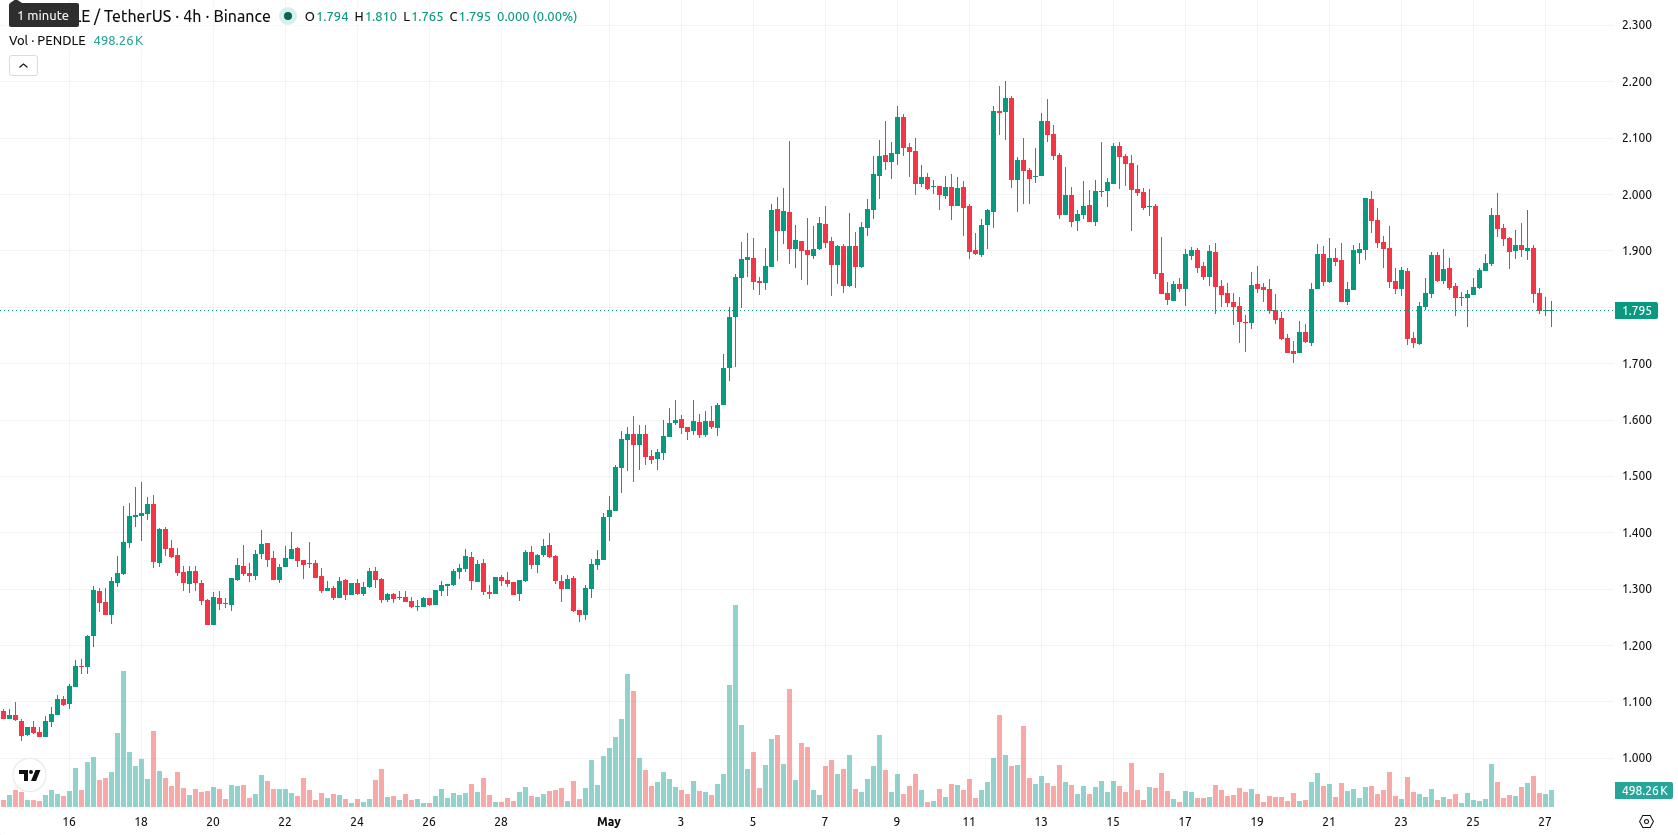
Pendle (PENDLE) is trading at $1.793, down 7.00% on the day and positioned below its key short-term moving averages while remaining above medium- and long-term marks.
Highlights
- PENDLE experienced a sharp 7% intraday drop, reflecting significant short-term selling pressure and heightened volatility.
- Momentum indicators are mixed, with daily signals diverging and failing to confirm either a clear reversal or new trend strength.
- Price is expected to trade between $1.794 and $2.022 in the coming week, with downside risk prevailing unless $2.02 is reclaimed.
Mixed technical signals as momentum weakens and volatility rises
On the technical side, PENDLE’s price is currently below the SMA-20 ($1.9154), yet remains above the SMA-50 ($1.5693) and SMA-200 ($1.7248), establishing $1.5693 and $1.7248 as underlying support levels. The Ichimoku Kijun is precisely at $1.7930, offering no clear bias or magnet. Momentum data is mixed: the D1 MACD indicates a strong buy signal, and ADX affirms trend strength, but Stoch RSI is deeply oversold, CCI is negative, and the D1 RSI at 50.4 only marginally favors buyers. BBP is positive, suggesting some intraday buyer presence, yet price action shows strong downward pressure after the recent 7% drop, with PENDLE near intraday lows of $1.765 amid elevated volatility.
Downside scenario favored as key technicals undermine rebound odds
Looking ahead, the short-term volatility band for PENDLE is likely to be between $1.794 and $2.022 relative to current levels. The probability of a price increase in the coming week is considered low (below 20%), as weekly MACD, SMA-50, and RSI readings all align to the downside. The base scenario favors sideways drift within this band, with a bullish case requiring a break above $2.02 to trigger upward momentum. Conversely, a sustained move below $1.76 could open the door to further seller-driven losses.
Previously it was reported that Pendle was entering a consolidation phase with downside risks outweighing immediate upside potential. Current technical signals reinforce this cautious outlook, making the $1.76 level pivotal for traders to monitor as any sustained move below it could accelerate bearish momentum.


-
 Afghanistan
-
 Albania
-
 Algeria
-
 Angola
-
 Argentina
-
 Armenia
-
 Australia
-
 Austria
-
 Azerbaijan
-
 Bahamas
-
 Bahrain
-
 Bangladesh
-
 Belarus
-
 Belgium
-
 Bolivia
-
 Botswana
-
 Brazil
-
 Brunei
-
 Bulgaria
-
 Cambodia
-
 Cameroon
-
 Canada
-
 Chile
Chile
-
 China
China
-
 Colombia
-
 Congo
Congo
-
 Costa Rica
-
 Cote d'Ivoire
-
 Croatia
-
 Cuba
Cuba
-
 Cyprus
-
 Czechia
-
 DR Congo
-
 Denmark
-
 Dominican Republic
-
 Ecuador
-
 Egypt
Egypt
-
 El Salvador
-
 Estonia
-
 Eswatini
-
 Ethiopia
-
 Finland
-
 France
-
 Georgia
-
 Germany
-
 Ghana
Ghana
-
 Greece
-
 Haiti
Haiti
-
 Hong Kong
-
 Hungary
-
 India
India
-
 Indonesia
-
 Iran, Islamic republic
-
 Iraq
Iraq
-
 Ireland
-
 Israel
-
 Italy
Italy
-
 Jamaica
-
 Japan
Japan
-
 Jordan
-
 Kazakhstan
-
 Kenya
Kenya
-
 Korea
Korea
-
 Kuwait
-
 Kyrgyzstan
-
 Laos
Laos
-
 Latvia
-
 Lebanon
-
 Lesotho
-
 Libya
Libya
-
 Lithuania
-
 Luxembourg
-
 Madagascar
-
 Malaysia
-
 Malta
Malta
-
 Mauritius
-
 Mexico
-
 Moldova
-
 Mongolia
-
 Montenegro
-
 Morocco
-
 Mozambique
-
 Myanmar
-
 Namibia
-
 Nepal
Nepal
-
 Netherlands
-
 New Zealand
-
 Nigeria
-
 North Macedonia
-
 Norway
-
 Oman
Oman
-
 Pakistan
-
 Palestine
-
 Panama
-
 Papua New Guinea
-
 Paraguay
-
 Peru
Peru
-
 Philippines
-
 Poland
-
 Portugal
-
 Puerto Rico
-
 Qatar
Qatar
-
 Reunion
-
 Romania
-
 Rwanda
-
 Saudi Arabia
-
 Serbia
-
 Singapore
-
 Slovakia
-
 Slovenia
-
 Somalia
-
 South Africa
-
 Spain
Spain
-
 Sri Lanka
-
 Sweden
-
 Switzerland
-
 Syria
Syria
-
 Taiwan
-
 Tajikistan
-
 Tanzania
-
 Thailand
-
 Trinidad and Tobago
-
 Tunisia
-
 Turkey
-
 UAE
UAE
-
 Uganda
-
 Ukraine
-
 United Kingdom
-
United States
-
 Uruguay
-
 Uzbekistan
-
 Venezuela
-
 Vietnam
-
 Yemen
Yemen
-
 Zambia
-
 Zimbabwe
- Forex
- Crypto
