
HBAR edges higher as price retests MA-20 resistance: weekly outlook

Hedera (HBAR) is currently trading at $0.0933, sitting exactly at its weekly MA-20 level but remaining well below the MA-50 at $0.1506 and the MA-200 at $0.1106. Over the last week, HBAR has recovered $0.0040 (4.43%), closing at the top of its recent range yet still facing downward pressure from bearish medium- and long-term signals.
 0.0715
0.0776
0.0715
0.0776
Highlights
- HBAR remains under medium- and long-term selling pressure, trading below key moving average resistance levels.
- Technical indicators signal a bearish trend with weak momentum, as seller dominance persists amid volatility.
- Expected trading range is $0.088 to $0.098 next week, with a sideways to bearish bias and low probability of sustained upward movement.
ETF filings, lawsuit, and tokenization drive institutional and ecosystem dynamics this week
Hedera has filed a lawsuit in New York against Exponential Science entities, seeking control over tens of millions of dollars in unspent HBAR grant funds originally intended for ecosystem development. Institutional engagement is increasing as fifteen HBAR-focused ETF filings from firms like Grayscale and Bitwise are under SEC review, and a Canary HBAR spot ETF reportedly holds 549 million HBAR. The network also continues to attract enterprise tokenization pilots, with Chainlink's CCIP now live for broader cross-chain use cases.
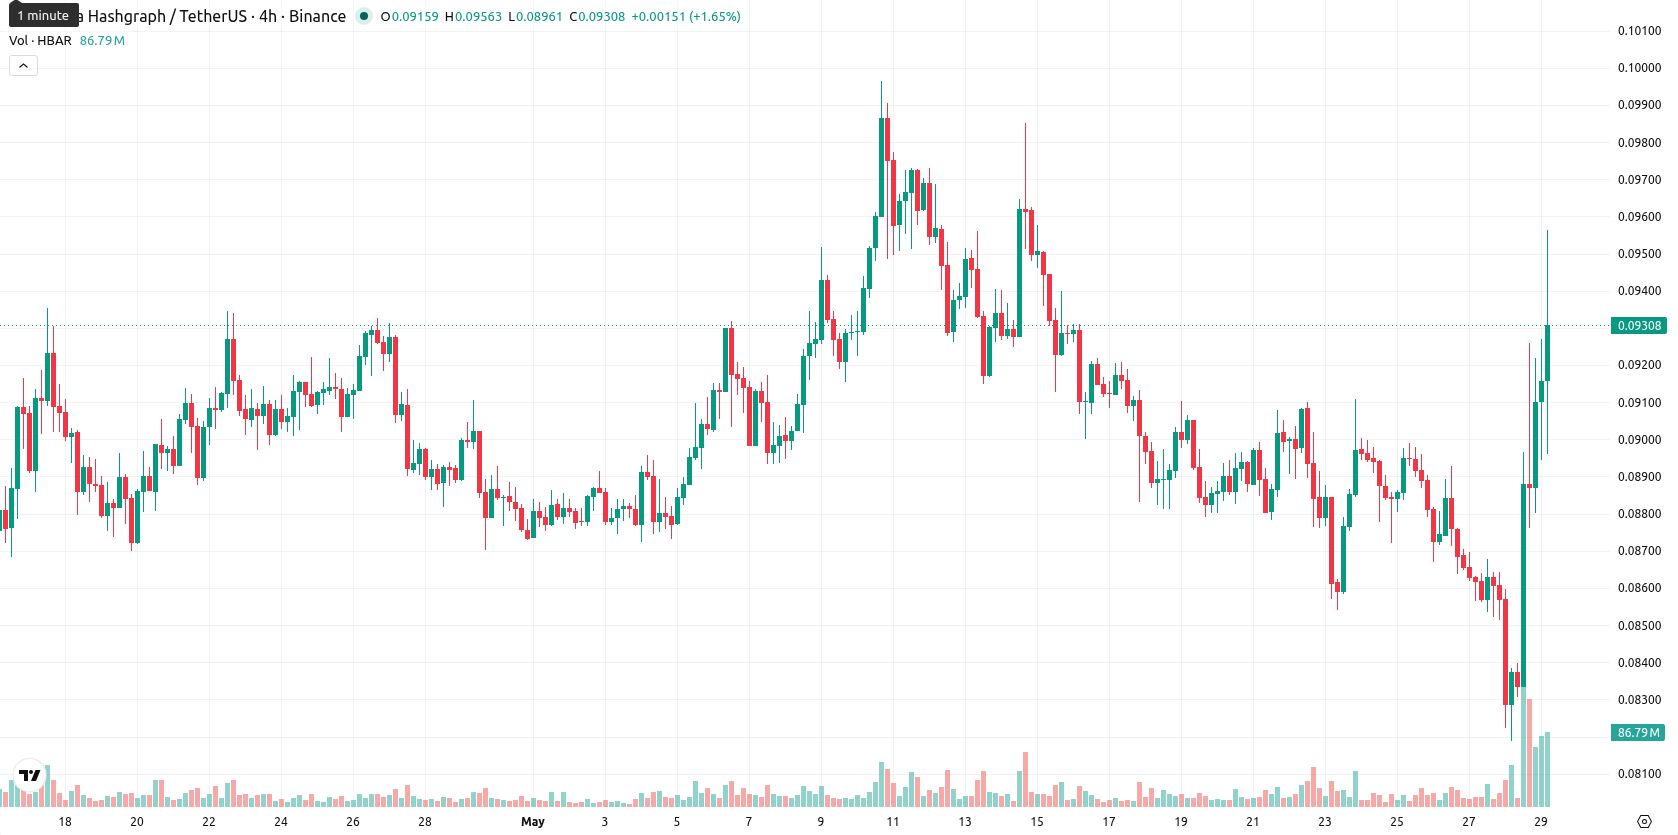
Bearish momentum confirmed as technical signals deteriorate over the week
On the weekly timeframe, HBAR’s price rests at its MA-20 ($0.0933), while remaining notably beneath its MA-50 ($0.1506) and MA-200 ($0.1106), confirming persistent selling pressure. Weekly momentum is largely bearish, as indicated by MACD, ADX, and CCI all signaling downside with weak strength; RSI hovers below 40, reinforcing subdued sentiment, and Stochastic RSI is in an overbought state — a divergence during what is typically a downtrend phase. Weekly volatility amplitude reached 13.06%, with Bull/Bear Power favoring sellers. Immediate technical resistance appears near the MA-20, while weekly support is distant, reflecting heightened caution.
Sideways bias dominates amid limited upside signals for the coming week
For the next 7 days, HBAR is likely to oscillate within a range of $0.088 to $0.098, based on its weekly volatility band. Strong bearish momentum and lack of buy signals from any of the four principal weekly indicators point to a low probability (under 20%) of sustained upward movement, favoring a sideways or renewed downward path. Upside scenarios require a decisive close above $0.098 to shift sentiment; dropping below $0.088 could prompt renewed selling and further downside risk.
Earlier, analysts noted that despite growing institutional interest and ongoing interoperability initiatives, Hedera’s technical outlook remained uncertain amid mixed momentum signals and unresolved legal disputes. The current analysis confirms that persistent bearish momentum and weak indicator strength continue to dominate, with traders advised to watch for a decisive move through the $0.098 resistance or a breakdown below $0.088 as triggers for renewed directional momentum.









-
 Afghanistan
-
 Albania
-
 Algeria
-
 Angola
-
 Argentina
-
 Armenia
-
 Australia
-
 Austria
-
 Azerbaijan
-
 Bahamas
-
 Bahrain
-
 Bangladesh
-
 Belarus
-
 Belgium
-
 Bolivia
-
 Botswana
-
 Brazil
-
 Brunei
-
 Bulgaria
-
 Cambodia
-
 Cameroon
-
 Canada
-
 Chile
Chile
-
 China
China
-
 Colombia
-
 Congo
Congo
-
 Costa Rica
-
 Cote d'Ivoire
-
 Croatia
-
 Cuba
Cuba
-
 Cyprus
-
 Czechia
-
 DR Congo
-
 Denmark
-
 Dominican Republic
-
 Ecuador
-
 Egypt
Egypt
-
 El Salvador
-
 Estonia
-
 Eswatini
-
 Ethiopia
-
 Finland
-
 France
-
 Georgia
-
 Germany
-
 Ghana
Ghana
-
 Greece
-
 Haiti
Haiti
-
 Hong Kong
-
 Hungary
-
 India
India
-
 Indonesia
-
 Iran, Islamic republic
-
 Iraq
Iraq
-
 Ireland
-
 Israel
-
 Italy
Italy
-
 Jamaica
-
 Japan
Japan
-
 Jordan
-
 Kazakhstan
-
 Kenya
Kenya
-
 Korea
Korea
-
 Kuwait
-
 Kyrgyzstan
-
 Laos
Laos
-
 Latvia
-
 Lebanon
-
 Lesotho
-
 Libya
Libya
-
 Lithuania
-
 Luxembourg
-
 Madagascar
-
 Malaysia
-
 Malta
Malta
-
 Mauritius
-
 Mexico
-
 Moldova
-
 Mongolia
-
 Montenegro
-
 Morocco
-
 Mozambique
-
 Myanmar
-
 Namibia
-
 Nepal
Nepal
-
 Netherlands
-
 New Zealand
-
 Nigeria
-
 North Macedonia
-
 Norway
-
 Oman
Oman
-
 Pakistan
-
 Palestine
-
 Panama
-
 Papua New Guinea
-
 Paraguay
-
 Peru
Peru
-
 Philippines
-
 Poland
-
 Portugal
-
 Puerto Rico
-
 Qatar
Qatar
-
 Reunion
-
 Romania
-
 Rwanda
-
 Saudi Arabia
-
 Serbia
-
 Singapore
-
 Slovakia
-
 Slovenia
-
 Somalia
-
 South Africa
-
 Spain
Spain
-
 Sri Lanka
-
 Sweden
-
 Switzerland
-
 Syria
Syria
-
 Taiwan
-
 Tajikistan
-
 Tanzania
-
 Thailand
-
 Trinidad and Tobago
-
 Tunisia
-
 Turkey
-
 UAE
UAE
-
 Uganda
-
 Ukraine
-
 United Kingdom
-
United States
-
 Uruguay
-
 Uzbekistan
-
 Venezuela
-
 Vietnam
-
 Yemen
Yemen
-
 Zambia
-
 Zimbabwe
- Forex
- Crypto











