
Pendle drops 7.74% as volatile trading drives price toward $1.40 support

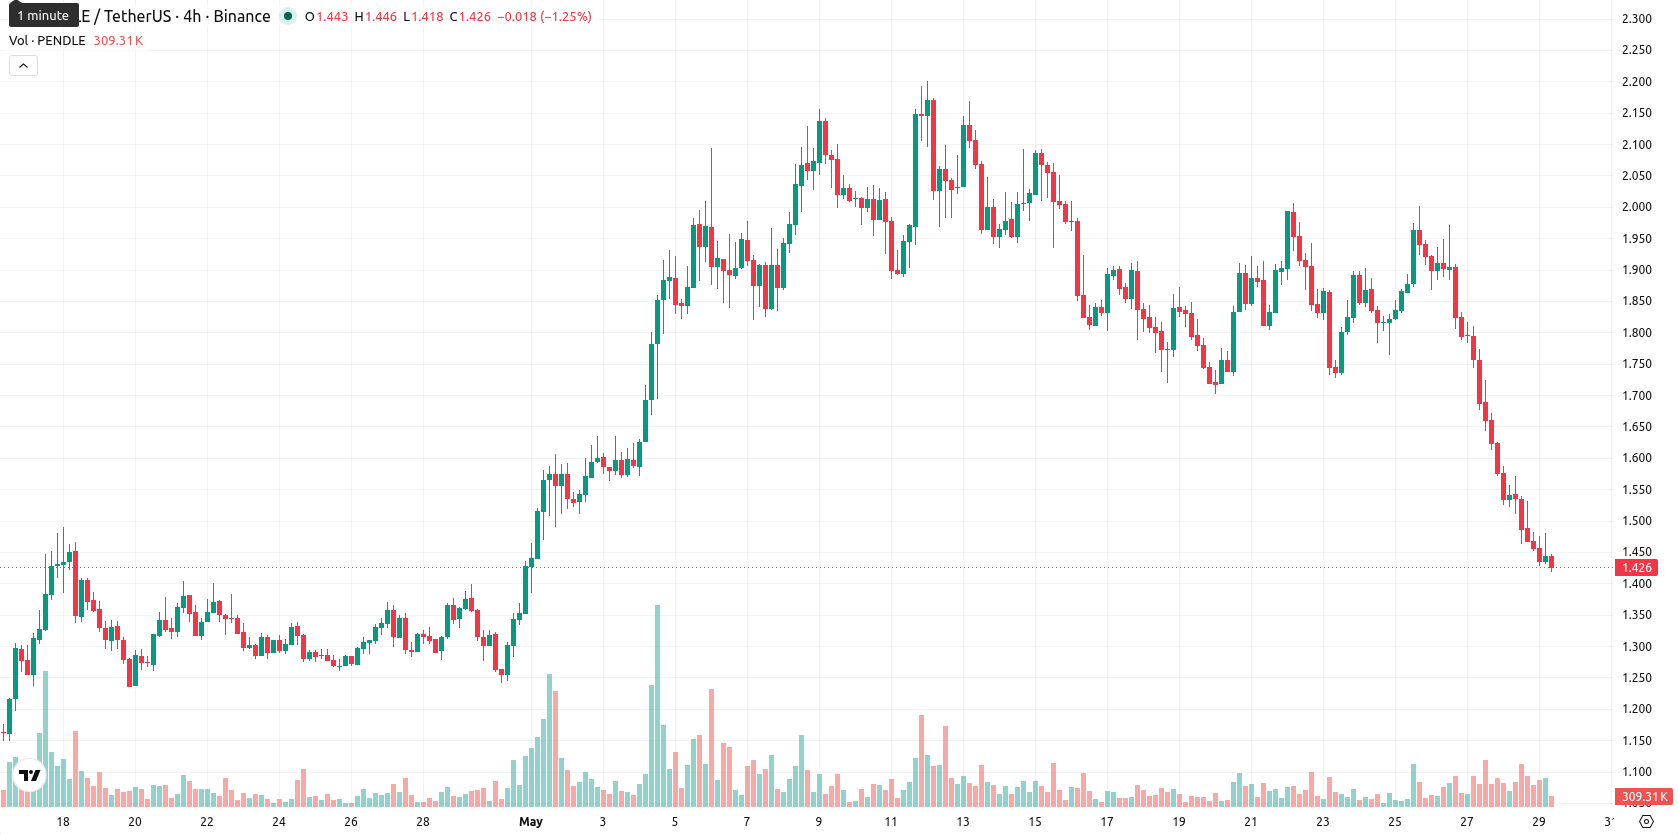
Pendle (PENDLE) is trading at $1.43 after a daily decline of 7.74%. The asset remains below its key moving averages, reflecting ongoing downward momentum relative to recent price benchmarks.
Highlights
- PENDLE is entrenched in a bearish trend, trading well below all key short- to long-term moving averages.
- Negative momentum and oversold conditions reinforce ongoing seller dominance, as intraday volatility persists near session lows.
- Price is expected to remain within a $1.40 to $1.58 range next week, with resistance at $1.83 and further downside likely unless support fails.
Support breaches and oversold signals reinforce bearish control
On the technical side, PENDLE is trading below the SMA-20 ($1.87), SMA-50 ($1.59), and SMA-200 ($1.71), with the Ichimoku Kijun level at $1.83 representing immediate resistance. Momentum indicators confirm prevailing weakness: the MACD remains neutral, while the ADX reads 33.95, reinforcing a strong sell trend. Oscillators show oversold conditions, with RSI at 38.03, CCI registering -242.26, and a zero-value Stoch RSI. Bearish dominance is further supported by a negative BBP. The Awesome Oscillator remains neutral, and price action has been highly volatile, opening lower and closing near the day’s lows, with no positive divergence observed across indicators.
Sideways trading zone likely as bullish triggers remain absent
Over the next week, PENDLE is expected to trade within a typical volatility band of $1.40 to $1.58, roughly in line with current conditions. The likelihood of a sustained price increase is low, remaining below 20%, as sell signals persist across multiple weekly technical indicators. The most probable scenario calls for the asset to remain in a sideways channel between $1.40 and $1.58. A break above $1.83 would be required for a bullish setup, while a drop beneath $1.40 could prompt further downside extension.
Earlier, analysts noted that Pendle exhibited persistent downside momentum as sellers dominated and technical signals pointed to oversold conditions. The latest market action reinforces this bearish narrative, and with volatility elevated and support under pressure, traders should closely monitor the $1.40 level for signs of either stabilization or a further breakdown.


-
 Afghanistan
-
 Albania
-
 Algeria
-
 Angola
-
 Argentina
-
 Armenia
-
 Australia
-
 Austria
-
 Azerbaijan
-
 Bahamas
-
 Bahrain
-
 Bangladesh
-
 Belarus
-
 Belgium
-
 Bolivia
-
 Botswana
-
 Brazil
-
 Brunei
-
 Bulgaria
-
 Cambodia
-
 Cameroon
-
 Canada
-
 Chile
Chile
-
 China
China
-
 Colombia
-
 Congo
Congo
-
 Costa Rica
-
 Cote d'Ivoire
-
 Croatia
-
 Cuba
Cuba
-
 Cyprus
-
 Czechia
-
 DR Congo
-
 Denmark
-
 Dominican Republic
-
 Ecuador
-
 Egypt
Egypt
-
 El Salvador
-
 Estonia
-
 Eswatini
-
 Ethiopia
-
 Finland
-
 France
-
 Georgia
-
 Germany
-
 Ghana
Ghana
-
 Greece
-
 Haiti
Haiti
-
 Hong Kong
-
 Hungary
-
 India
India
-
 Indonesia
-
 Iran, Islamic republic
-
 Iraq
Iraq
-
 Ireland
-
 Israel
-
 Italy
Italy
-
 Jamaica
-
 Japan
Japan
-
 Jordan
-
 Kazakhstan
-
 Kenya
Kenya
-
 Korea
Korea
-
 Kuwait
-
 Kyrgyzstan
-
 Laos
Laos
-
 Latvia
-
 Lebanon
-
 Lesotho
-
 Libya
Libya
-
 Lithuania
-
 Luxembourg
-
 Madagascar
-
 Malaysia
-
 Malta
Malta
-
 Mauritius
-
 Mexico
-
 Moldova
-
 Mongolia
-
 Montenegro
-
 Morocco
-
 Mozambique
-
 Myanmar
-
 Namibia
-
 Nepal
Nepal
-
 Netherlands
-
 New Zealand
-
 Nigeria
-
 North Macedonia
-
 Norway
-
 Oman
Oman
-
 Pakistan
-
 Palestine
-
 Panama
-
 Papua New Guinea
-
 Paraguay
-
 Peru
Peru
-
 Philippines
-
 Poland
-
 Portugal
-
 Puerto Rico
-
 Qatar
Qatar
-
 Reunion
-
 Romania
-
 Rwanda
-
 Saudi Arabia
-
 Serbia
-
 Singapore
-
 Slovakia
-
 Slovenia
-
 Somalia
-
 South Africa
-
 Spain
Spain
-
 Sri Lanka
-
 Sweden
-
 Switzerland
-
 Syria
Syria
-
 Taiwan
-
 Tajikistan
-
 Tanzania
-
 Thailand
-
 Trinidad and Tobago
-
 Tunisia
-
 Turkey
-
 UAE
UAE
-
 Uganda
-
 Ukraine
-
 United Kingdom
-
United States
-
 Uruguay
-
 Uzbekistan
-
 Venezuela
-
 Vietnam
-
 Yemen
Yemen
-
 Zambia
-
 Zimbabwe
- Forex
- Crypto
