
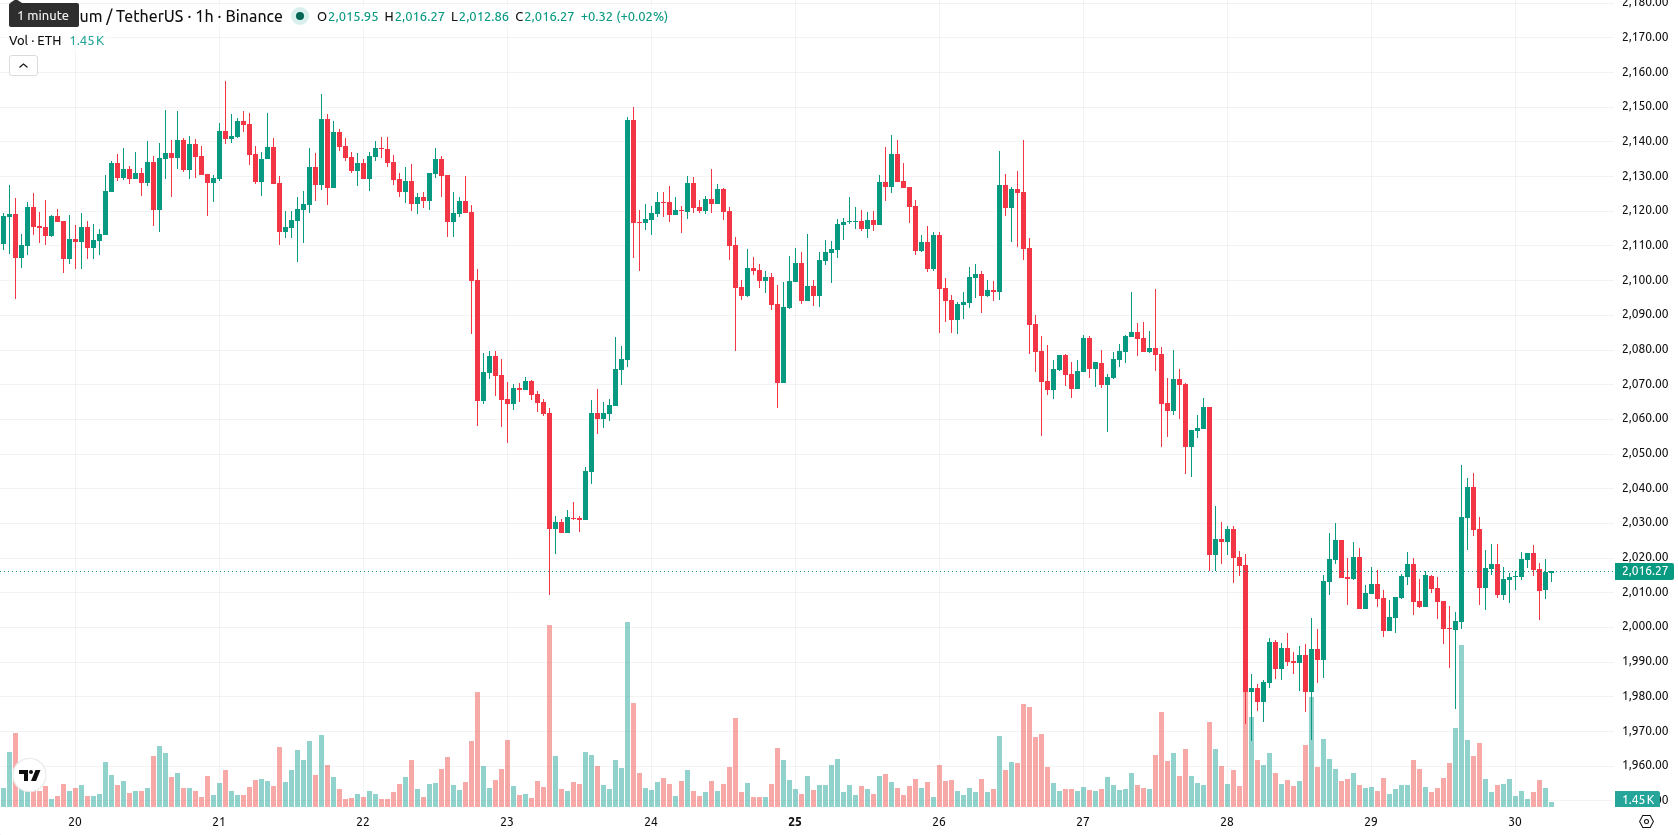
Ethereum price prediction: $2,000 support in focus? ETH consolidates around $2,015.83

Ethereum (ETH) is trading at $2,015.83, essentially flat on the day after slipping 0.03%. The asset remains below its key moving averages, reflecting subdued price action within a narrow daily range and continued pressure from sellers.
Highlights
- U.S.-listed spot Ethereum ETFs saw 13 straight days of outflows, with institutional investors withdrawing over $695 million, intensifying selling pressure.
- Despite net outflows, Bit Digital added $20 million in Ethereum to its treasury, contrasting with broader institutional withdrawal trends.
- Ethereum trades below key moving averages with persistent bearish momentum; price is expected to remain between $1,970 and $2,025 with downside risk prevailing.
Persistent ETF outflows and selective buying reinforce supply squeeze
U.S.-listed spot Ethereum ETFs recorded 13 consecutive days of net outflows, with institutional investors withdrawing over $695 million. This reduction in assets under management signals sustained selling pressure and translates directly to lower demand and diminished liquidity in the secondary market. In contrast, Bit Digital added $20 million in Ethereum to its treasury, marking isolated corporate buying activity amid industry-wide withdrawals. Meanwhile, the continued growth in staked ETH and ongoing deflationary mechanisms further restricts available supply, though price action has remained under broader selling pressure.
Downtrend persists as ETH trades under resistance and momentum turns negative
ETH is currently trading below the SMA-20 at $2,154.21, SMA-50 at $2,252.20, and SMA-200 at $2,512.50, with the Ichimoku Kijun level at $2,195.37 acting as immediate resistance above the market. The key support and resistance levels are at $2,000 and $2,195, respectively. Momentum readings remain negative across both daily and weekly timeframes, as the MACD and ADX (21.10) confirm a persistent downtrend. Short-term indicators like RSI (31.07), CCI (–112.29), and BBP (–49.05) signal that ETH is in oversold territory, and the Stoch RSI also flags oversold conditions. The Awesome Oscillator supports the prevailing bearish setup.
Downside risk dominates as technicals constrain bullish recovery
Over the next five trading days, ETH is expected to move within a narrow corridor ranging from $1,970 to $2,025 in line with typical volatility bands. The probability of an upward move remains low—less than 20%—with bearish momentum persisting and likely to limit any short-term rebounds. A bullish pricing scenario would require a close above immediate resistance at $2,195, while a bearish move could extend through the $2,000 support zone. Overall, risks are skewed to the downside as negative signals dominate across multiple timeframes.
Earlier, analysts noted that Ethereum's bearish outlook was driven by persistent institutional outflows and oversold technical conditions. This view is reinforced by the ongoing streak of ETF redemptions and negative momentum, suggesting traders should monitor for a decisive move outside the $1,970–$2,025 range as a signal for the next directional shift.


Latest Ethereum News


-
 Afghanistan
-
 Albania
-
 Algeria
-
 Angola
-
 Argentina
-
 Armenia
-
 Australia
-
 Austria
-
 Azerbaijan
-
 Bahamas
-
 Bahrain
-
 Bangladesh
-
 Belarus
-
 Belgium
-
 Bolivia
-
 Botswana
-
 Brazil
-
 Brunei
-
 Bulgaria
-
 Cambodia
-
 Cameroon
-
 Canada
-
 Chile
Chile
-
 China
China
-
 Colombia
-
 Congo
Congo
-
 Costa Rica
-
 Cote d'Ivoire
-
 Croatia
-
 Cuba
Cuba
-
 Cyprus
-
 Czechia
-
 DR Congo
-
 Denmark
-
 Dominican Republic
-
 Ecuador
-
 Egypt
Egypt
-
 El Salvador
-
 Estonia
-
 Eswatini
-
 Ethiopia
-
 Finland
-
 France
-
 Georgia
-
 Germany
-
 Ghana
Ghana
-
 Greece
-
 Haiti
Haiti
-
 Hong Kong
-
 Hungary
-
 India
India
-
 Indonesia
-
 Iran, Islamic republic
-
 Iraq
Iraq
-
 Ireland
-
 Israel
-
 Italy
Italy
-
 Jamaica
-
 Japan
Japan
-
 Jordan
-
 Kazakhstan
-
 Kenya
Kenya
-
 Korea
Korea
-
 Kuwait
-
 Kyrgyzstan
-
 Laos
Laos
-
 Latvia
-
 Lebanon
-
 Lesotho
-
 Libya
Libya
-
 Lithuania
-
 Luxembourg
-
 Madagascar
-
 Malaysia
-
 Malta
Malta
-
 Mauritius
-
 Mexico
-
 Moldova
-
 Mongolia
-
 Montenegro
-
 Morocco
-
 Mozambique
-
 Myanmar
-
 Namibia
-
 Nepal
Nepal
-
 Netherlands
-
 New Zealand
-
 Nigeria
-
 North Macedonia
-
 Norway
-
 Oman
Oman
-
 Pakistan
-
 Palestine
-
 Panama
-
 Papua New Guinea
-
 Paraguay
-
 Peru
Peru
-
 Philippines
-
 Poland
-
 Portugal
-
 Puerto Rico
-
 Qatar
Qatar
-
 Reunion
-
 Romania
-
 Rwanda
-
 Saudi Arabia
-
 Serbia
-
 Singapore
-
 Slovakia
-
 Slovenia
-
 Somalia
-
 South Africa
-
 Spain
Spain
-
 Sri Lanka
-
 Sweden
-
 Switzerland
-
 Syria
Syria
-
 Taiwan
-
 Tajikistan
-
 Tanzania
-
 Thailand
-
 Trinidad and Tobago
-
 Tunisia
-
 Turkey
-
 UAE
UAE
-
 Uganda
-
 Ukraine
-
 United Kingdom
-
United States
-
 Uruguay
-
 Uzbekistan
-
 Venezuela
-
 Vietnam
-
 Yemen
Yemen
-
 Zambia
-
 Zimbabwe
- Forex
- Crypto
