
Ethereum price prediction: $1,663.15 resistance? ETH trades sideways

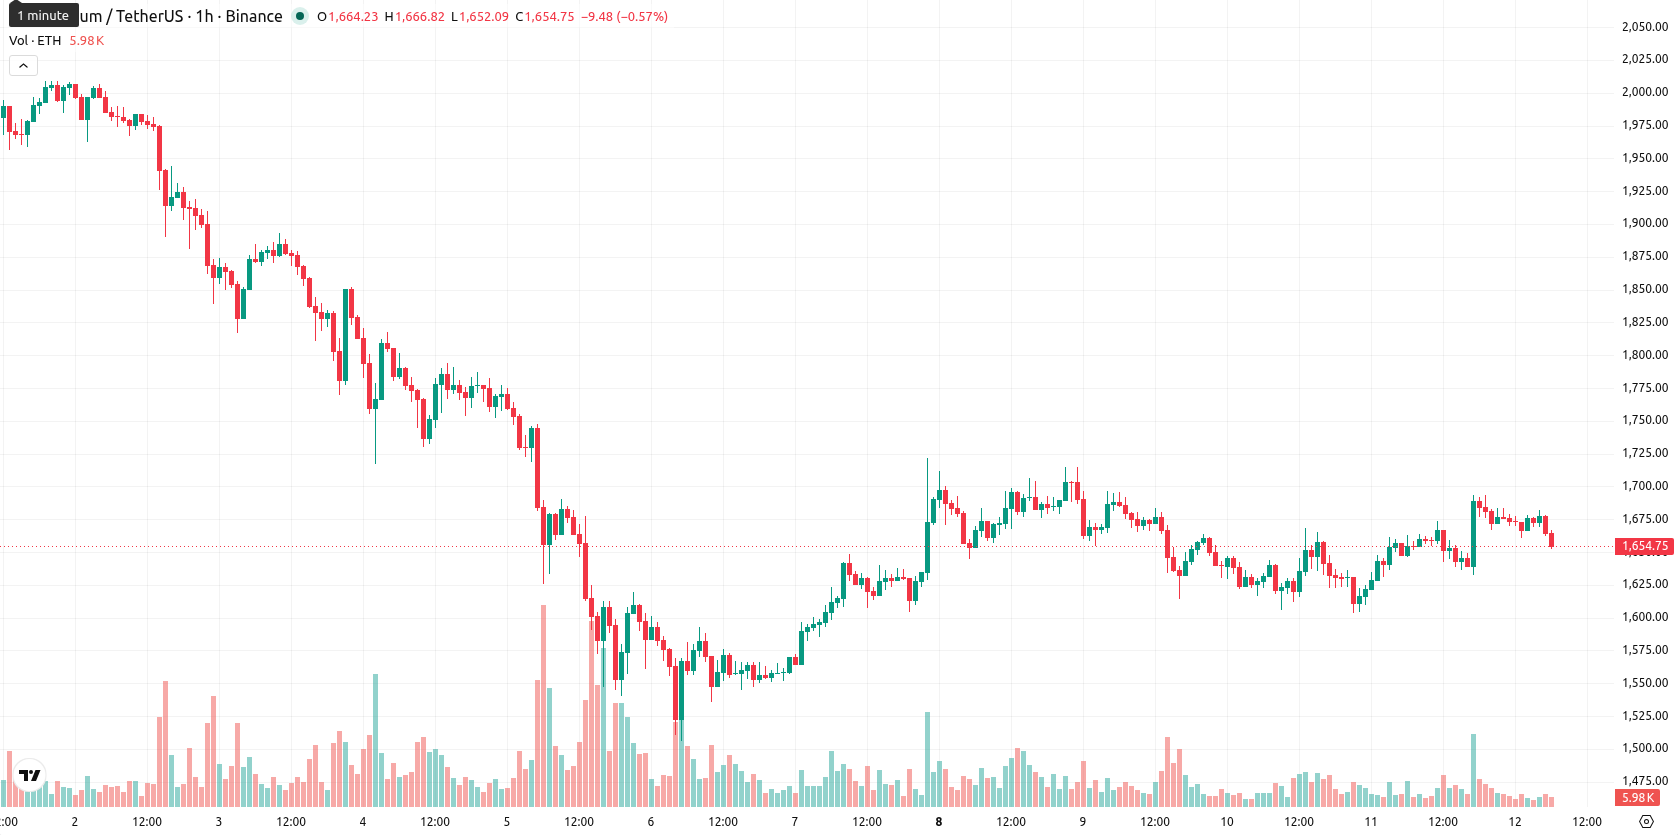
Ethereum (ETH) is trading at $1,660.45 with a daily gain of 0.02%. The price sits below its short-term moving average but remains above its intermediate-term average, while continuing to trade well under its long-term trend line.
Highlights
- Bitmine's acquisition of 125,000 ETH in three days underscores large-scale institutional demand during recent price weakness.
- Open interest in Ethereum derivatives on Binance has hit a six-year high of 616,400 ETH, suggesting increased leverage and short-term volatility risks.
- ETH/USD remains in a sideways range between $1,500.81 and $1,708.80, with mixed technical signals and a slightly higher probability of further downside.
Institutional accumulation and record leverage as volatility risk rises
Recent news highlights a major accumulation by Bitmine, which acquired 125,000 ETH over three days, providing evidence of significant institutional demand and absorbing market supply during a period of price softness, as reported by AMBCrypto. Complementing this, The Coin Republic has cited CryptoQuant data showing open interest in Ethereum derivatives on Binance reaching a six-year high of 616,400 ETH, increasing the market's leverage and elevating short-term volatility risk. Regulatory progress also continues as Bitcoin Sistemi reports that Ethereum developers are preparing EIP-8182 for the Hegotá hard fork, aiming to introduce native privacy features and potentially boost interest from privacy-focused users.
Mixed momentum with near-term resistance amid lingering bearish trend
On the technical front, ETH/USD is positioned below its MA-20 but above its MA-50 on the hourly chart, while the MA-200 remains overhead and confirms persistent long-term bearish pressure. The Ichimoku Kijun line is set at $1,663.15, acting as immediate resistance, with the price trading near today's session lows. Hourly momentum signals are mixed: MACD continues to signal strong buying, while the ADX is neutral, suggesting that market momentum exists but lacks a clear directional shape. RSI stands at 50.69 (Buy), Stoch RSI issues a Sell signal, CCI is neutral, BBP shows an overbought intraday bias, and AO remains neutral, highlighting divergent oscillator interpretations and pronounced intraday buyer presence.
Modest downside risk as rangebound trading remains the base case
Looking ahead to the next two to three trading days, ETH/USD is expected to range between $1,500.81 and $1,708.80, consistent with typical volatility bands for the asset. Probabilities currently favor continued mild weakness, with a 53% chance of a downward move versus 47% for a rebound. The base scenario sees Ethereum consolidating within this corridor, while an upside breakout would require a move above immediate resistance; conversely, a fall below key supports could trigger further downside.
Earlier, analysts noted that persistent macro pressures and ETF outflows had shifted Ethereum’s outlook toward caution and downside risk. New evidence of significant institutional accumulation and surging derivatives activity adds a complex layer to the market’s profile, making short-term volatility around key technical thresholds a critical factor for traders to monitor in the days ahead.


Latest Ethereum News


-
 Afghanistan
-
 Albania
-
 Algeria
-
 Angola
-
 Argentina
-
 Armenia
-
 Australia
-
 Austria
-
 Azerbaijan
-
 Bahamas
-
 Bahrain
-
 Bangladesh
-
 Belarus
-
 Belgium
-
 Bolivia
-
 Botswana
-
 Brazil
-
 Brunei
-
 Bulgaria
-
 Cambodia
-
 Cameroon
-
 Canada
-
 Chile
Chile
-
 China
China
-
 Colombia
-
 Congo
Congo
-
 Costa Rica
-
 Cote d'Ivoire
-
 Croatia
-
 Cuba
Cuba
-
 Cyprus
-
 Czechia
-
 DR Congo
-
 Denmark
-
 Dominican Republic
-
 Ecuador
-
 Egypt
Egypt
-
 El Salvador
-
 Estonia
-
 Eswatini
-
 Ethiopia
-
 Finland
-
 France
-
 Georgia
-
 Germany
-
 Ghana
Ghana
-
 Greece
-
 Haiti
Haiti
-
 Hong Kong
-
 Hungary
-
 India
India
-
 Indonesia
-
 Iran, Islamic republic
-
 Iraq
Iraq
-
 Ireland
-
 Israel
-
 Italy
Italy
-
 Jamaica
-
 Japan
Japan
-
 Jordan
-
 Kazakhstan
-
 Kenya
Kenya
-
 Korea
Korea
-
 Kuwait
-
 Kyrgyzstan
-
 Laos
Laos
-
 Latvia
-
 Lebanon
-
 Lesotho
-
 Libya
Libya
-
 Lithuania
-
 Luxembourg
-
 Madagascar
-
 Malaysia
-
 Malta
Malta
-
 Mauritius
-
 Mexico
-
 Moldova
-
 Mongolia
-
 Montenegro
-
 Morocco
-
 Mozambique
-
 Myanmar
-
 Namibia
-
 Nepal
Nepal
-
 Netherlands
-
 New Zealand
-
 Nigeria
-
 North Macedonia
-
 Norway
-
 Oman
Oman
-
 Pakistan
-
 Palestine
-
 Panama
-
 Papua New Guinea
-
 Paraguay
-
 Peru
Peru
-
 Philippines
-
 Poland
-
 Portugal
-
 Puerto Rico
-
 Qatar
Qatar
-
 Reunion
-
 Romania
-
 Rwanda
-
 Saudi Arabia
-
 Serbia
-
 Singapore
-
 Slovakia
-
 Slovenia
-
 Somalia
-
 South Africa
-
 Spain
Spain
-
 Sri Lanka
-
 Sweden
-
 Switzerland
-
 Syria
Syria
-
 Taiwan
-
 Tajikistan
-
 Tanzania
-
 Thailand
-
 Trinidad and Tobago
-
 Tunisia
-
 Turkey
-
 UAE
UAE
-
 Uganda
-
 Ukraine
-
 United Kingdom
-
United States
-
 Uruguay
-
 Uzbekistan
-
 Venezuela
-
 Vietnam
-
 Yemen
Yemen
-
 Zambia
-
 Zimbabwe
- Forex
- Crypto
