
Plasma price prediction: Will $0.0572–$0.0760 range hold as XPL loses ground?

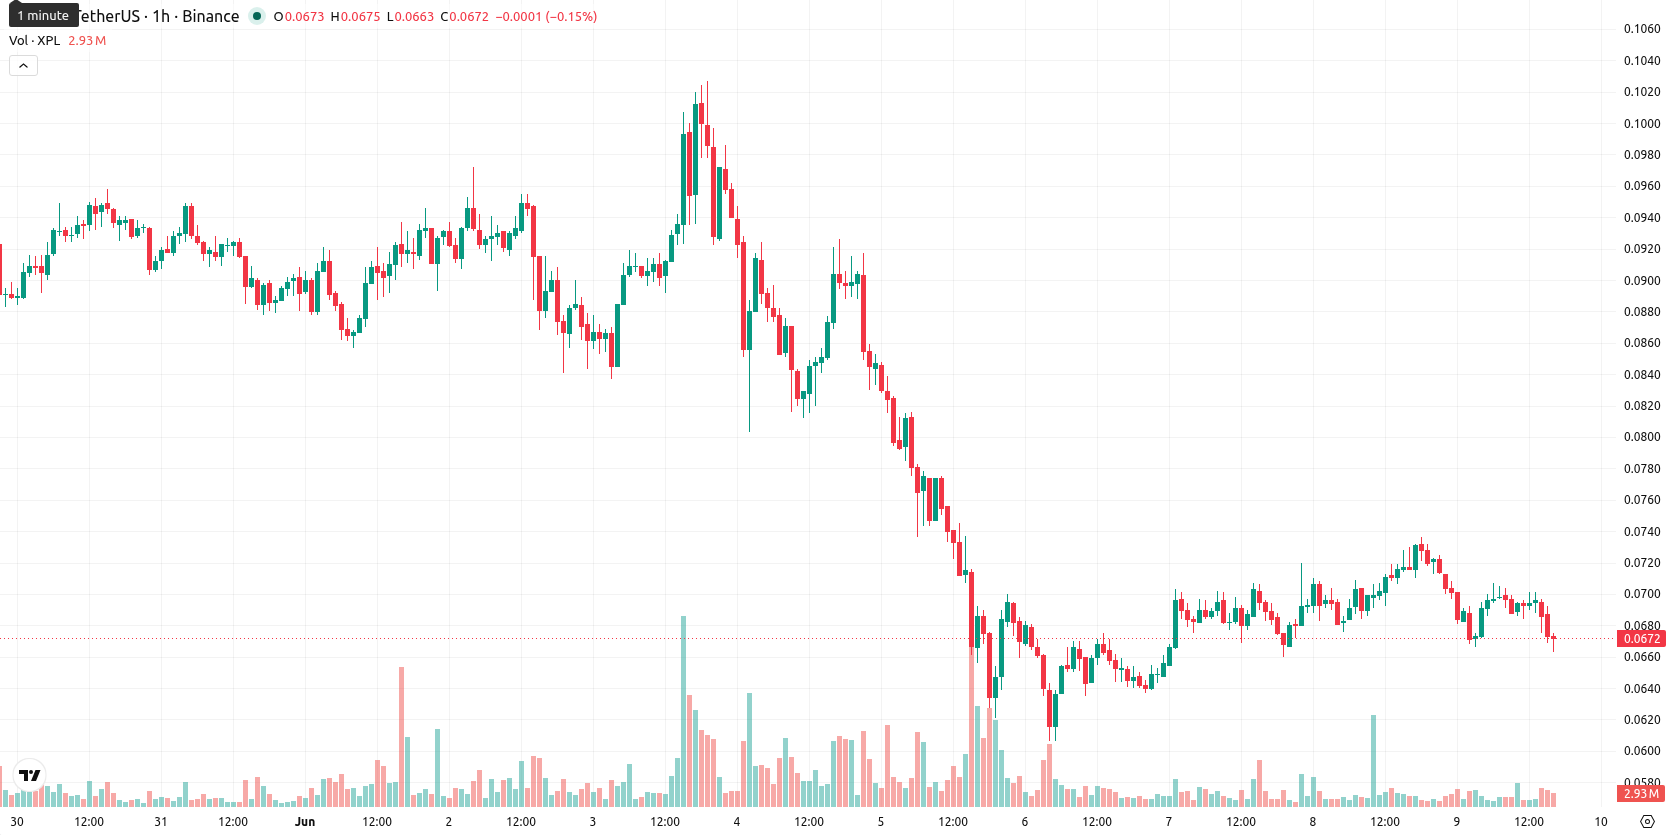
Plasma (XPL) is trading at $0.0666, down 8.52% over the past day and nearing session lows. The asset remains below its key moving averages, reflecting ongoing near-term selling momentum.
Highlights
- XPL/USD remains under persistent selling pressure, trading below key moving averages on all major timeframes.
- Bearish momentum dominates as most technical indicators show weakness, though some oversold signals suggest a possible short-term rebound.
- Expect price action between $0.0572 and $0.0760 over the next few days, with a strong likelihood of further downside barring a decisive break above $0.0701.
Downside pressure persists as technicals signal continued bearish momentum
On the H1 timeframe, XPL is trading below its MA-20 ($0.0693) and MA-50 ($0.0696), while the daily chart shows the price well under the MA-200 ($0.1208). The Ichimoku Kijun sits at $0.0701, serving as immediate resistance for any rebounds. Technical momentum is dominated by selling signals, with MACD on Sell and RSI at 38.78, indicating a sell bias, while CCI is in oversold territory. Stoch RSI and ADX present neutral conditions, highlighting the lack of a strong short-term trend; meanwhile, BBP signals some buyer activity, but the Awesome Oscillator supports further downside. Price action reveals intraday losses of 8.52% with high volatility and trading near session lows, underscoring ongoing downside pressure and a clash between oversold oscillator readings and persistent seller dominance.
Volatility band sets range as price action faces sideways bias
In the next 2 6 trading days, XPL/USD is likely to fluctuate between $0.0572 and $0.0760, reflecting its typical volatility band relative to current levels. The base case scenario anticipates sideways movement within this range. A move above $0.0701 could signal a short-term recovery attempt, while a breakdown below $0.0572 may open the path to deeper losses.
Earlier, analysts noted that while Plasma showed renewed short-term bullish momentum, increased token supply on exchanges posed ongoing volatility and downside risk. The current breakdown below key moving averages and oversold oscillators further underscores this vulnerability, making the $0.0572 support level crucial to monitor for any escalation in selling pressure.


Latest Plasma News


-
 Afghanistan
-
 Albania
-
 Algeria
-
 Angola
-
 Argentina
-
 Armenia
-
 Australia
-
 Austria
-
 Azerbaijan
-
 Bahamas
-
 Bahrain
-
 Bangladesh
-
 Belarus
-
 Belgium
-
 Bolivia
-
 Botswana
-
 Brazil
-
 Brunei
-
 Bulgaria
-
 Cambodia
-
 Cameroon
-
 Canada
-
 Chile
Chile
-
 China
China
-
 Colombia
-
 Congo
Congo
-
 Costa Rica
-
 Cote d'Ivoire
-
 Croatia
-
 Cuba
Cuba
-
 Cyprus
-
 Czechia
-
 DR Congo
-
 Denmark
-
 Dominican Republic
-
 Ecuador
-
 Egypt
Egypt
-
 El Salvador
-
 Estonia
-
 Eswatini
-
 Ethiopia
-
 Finland
-
 France
-
 Georgia
-
 Germany
-
 Ghana
Ghana
-
 Greece
-
 Haiti
Haiti
-
 Hong Kong
-
 Hungary
-
 India
India
-
 Indonesia
-
 Iran, Islamic republic
-
 Iraq
Iraq
-
 Ireland
-
 Israel
-
 Italy
Italy
-
 Jamaica
-
 Japan
Japan
-
 Jordan
-
 Kazakhstan
-
 Kenya
Kenya
-
 Korea
Korea
-
 Kuwait
-
 Kyrgyzstan
-
 Laos
Laos
-
 Latvia
-
 Lebanon
-
 Lesotho
-
 Libya
Libya
-
 Lithuania
-
 Luxembourg
-
 Madagascar
-
 Malaysia
-
 Malta
Malta
-
 Mauritius
-
 Mexico
-
 Moldova
-
 Mongolia
-
 Montenegro
-
 Morocco
-
 Mozambique
-
 Myanmar
-
 Namibia
-
 Nepal
Nepal
-
 Netherlands
-
 New Zealand
-
 Nigeria
-
 North Macedonia
-
 Norway
-
 Oman
Oman
-
 Pakistan
-
 Palestine
-
 Panama
-
 Papua New Guinea
-
 Paraguay
-
 Peru
Peru
-
 Philippines
-
 Poland
-
 Portugal
-
 Puerto Rico
-
 Qatar
Qatar
-
 Reunion
-
 Romania
-
 Rwanda
-
 Saudi Arabia
-
 Serbia
-
 Singapore
-
 Slovakia
-
 Slovenia
-
 Somalia
-
 South Africa
-
 Spain
Spain
-
 Sri Lanka
-
 Sweden
-
 Switzerland
-
 Syria
Syria
-
 Taiwan
-
 Tajikistan
-
 Tanzania
-
 Thailand
-
 Trinidad and Tobago
-
 Tunisia
-
 Turkey
-
 UAE
UAE
-
 Uganda
-
 Ukraine
-
 United Kingdom
-
United States
-
 Uruguay
-
 Uzbekistan
-
 Venezuela
-
 Vietnam
-
 Yemen
Yemen
-
 Zambia
-
 Zimbabwe
- Forex
- Crypto
