
Polkadot trades up as Agile Coretime model fuels developer demand

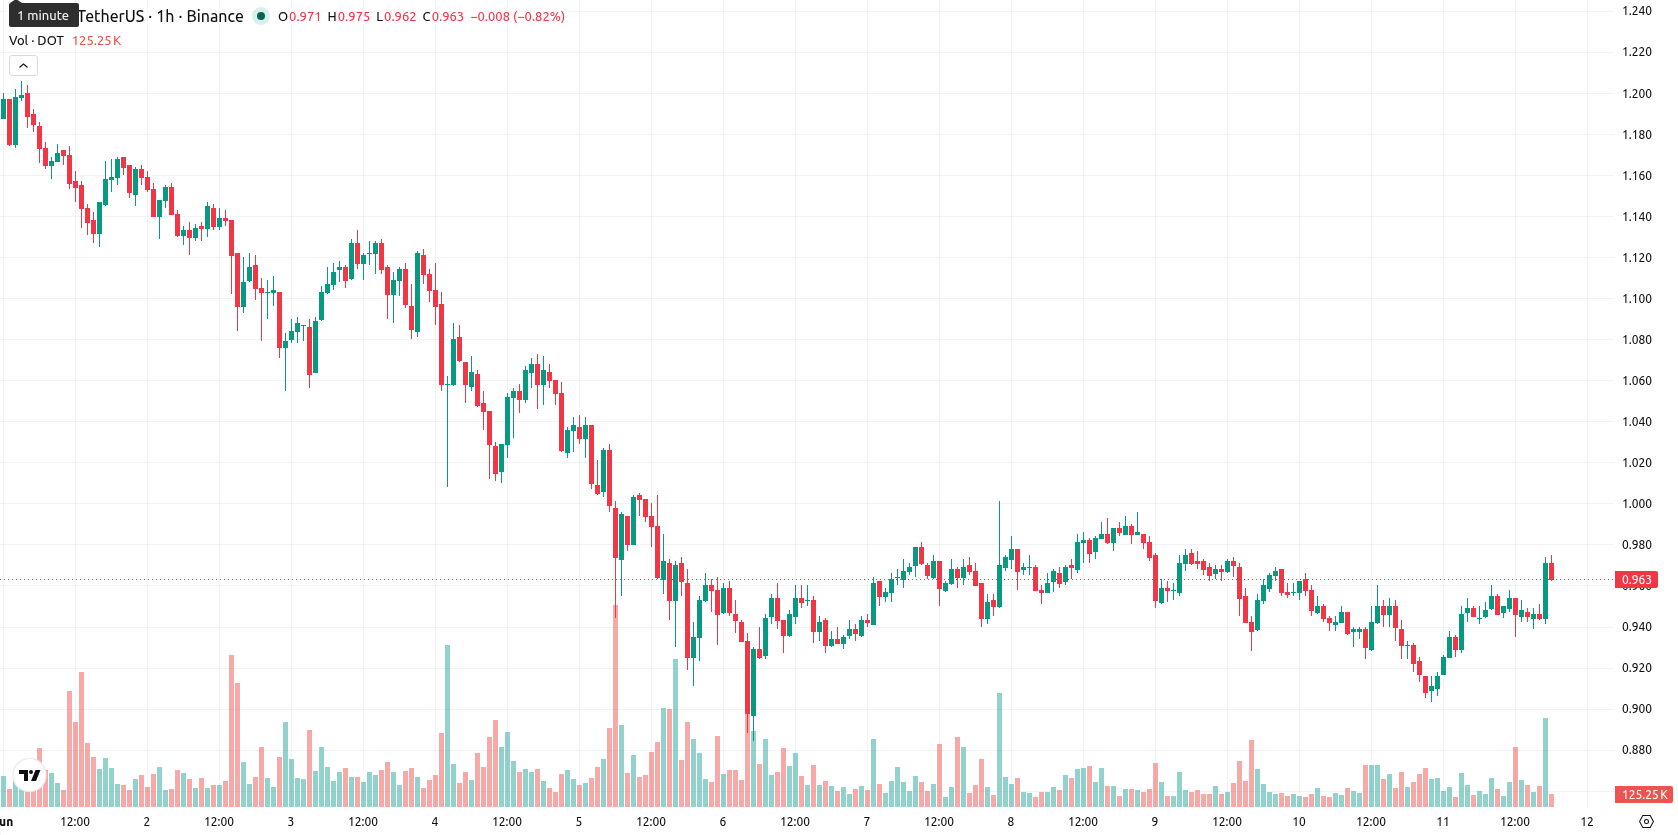
Polkadot (DOT) is trading at $0.974 after rising 4.62% in the last 24 hours. The asset is positioned above its short- and medium-term moving averages while remaining below longer-term trend levels.
Highlights
- Polkadot's enforced supply cap of 2.1 billion DOT and halved annual emission sharply increase token scarcity and accumulation incentives.
- The recent Polkadot 2.0 upgrade, with features like Agile Coretime and planned scalability enhancements, positions the network for greater developer demand and ecosystem growth.
- DOT shows intraday bullish momentum above near-term supports with a 76% probability of trading between $0.848 and $1.010 over the next few days, though overbought signals caution against rapid reversals.
Scarcity and developer demand rise as supply constraints and upgrades take effect
Polkadot’s recently enacted hard supply cap of 2.1 billion DOT and a 53.6% reduction in annual token issuance serve as a substantial constraint on future circulating supply, raising the scarcity profile for DOT and supporting ongoing accumulation. This decisive on-chain action was paired with the completed Polkadot 2.0 upgrade, which introduced Agile Coretime and shifted the network to a more flexible compute-resource model, potentially increasing developer demand for access. Further improvements, including Asynchronous Backing and Elastic Scaling finalized in October 2025, boost throughput and scalability, contributing to a more attractive operating environment for ecosystem projects.
Bullish bias faces overbought signals amid volatility risk
DOT/USD is currently trading above the MA-20 and MA-50 but remains below the MA-200 on the daily timeframe. Immediate support is identified at the Ichimoku Kijun level of $0.936, with a near-term resistance band at $1.010. Momentum indicators show mixed signals: the MACD supports ongoing buying, while the ADX remains neutral. The RSI stands at 64.30, suggesting a bullish bias, but both the Stoch RSI and CCI indicate the asset is in overbought territory. Intraday Bull/Bear Power (BBP) reveals strong buyer dominance, while the Awesome Oscillator is neutral, pointing to a market poised for volatility.
Range-bound outlook as breakout levels set direction risk
Over the next 2–3 trading days, typical volatility is seen within a range of $0.848 to $1.010. The baseline scenario anticipates sideways consolidation, with a 76% probability of an upward move and a 24% chance of a downward scenario. A close above $1.010 may trigger bullish momentum, while any decline below the $0.936 support would expose the price to the $0.848 level.
Earlier, analysts noted that Polkadot exhibited persistent bearish sentiment and technical weakness despite key disinflationary tokenomics changes and ongoing network upgrades. The current shift to consolidation with a bullish bias introduces the potential for renewed upward momentum, making a sustained daily close above $1.010 an important signal for trend reversal to monitor in the days ahead.


Latest Polkadot News


-
 Afghanistan
-
 Albania
-
 Algeria
-
 Angola
-
 Argentina
-
 Armenia
-
 Australia
-
 Austria
-
 Azerbaijan
-
 Bahamas
-
 Bahrain
-
 Bangladesh
-
 Belarus
-
 Belgium
-
 Bolivia
-
 Botswana
-
 Brazil
-
 Brunei
-
 Bulgaria
-
 Cambodia
-
 Cameroon
-
 Canada
-
 Chile
Chile
-
 China
China
-
 Colombia
-
 Congo
Congo
-
 Costa Rica
-
 Cote d'Ivoire
-
 Croatia
-
 Cuba
Cuba
-
 Cyprus
-
 Czechia
-
 DR Congo
-
 Denmark
-
 Dominican Republic
-
 Ecuador
-
 Egypt
Egypt
-
 El Salvador
-
 Estonia
-
 Eswatini
-
 Ethiopia
-
 Finland
-
 France
-
 Georgia
-
 Germany
-
 Ghana
Ghana
-
 Greece
-
 Haiti
Haiti
-
 Hong Kong
-
 Hungary
-
 India
India
-
 Indonesia
-
 Iran, Islamic republic
-
 Iraq
Iraq
-
 Ireland
-
 Israel
-
 Italy
Italy
-
 Jamaica
-
 Japan
Japan
-
 Jordan
-
 Kazakhstan
-
 Kenya
Kenya
-
 Korea
Korea
-
 Kuwait
-
 Kyrgyzstan
-
 Laos
Laos
-
 Latvia
-
 Lebanon
-
 Lesotho
-
 Libya
Libya
-
 Lithuania
-
 Luxembourg
-
 Madagascar
-
 Malaysia
-
 Malta
Malta
-
 Mauritius
-
 Mexico
-
 Moldova
-
 Mongolia
-
 Montenegro
-
 Morocco
-
 Mozambique
-
 Myanmar
-
 Namibia
-
 Nepal
Nepal
-
 Netherlands
-
 New Zealand
-
 Nigeria
-
 North Macedonia
-
 Norway
-
 Oman
Oman
-
 Pakistan
-
 Palestine
-
 Panama
-
 Papua New Guinea
-
 Paraguay
-
 Peru
Peru
-
 Philippines
-
 Poland
-
 Portugal
-
 Puerto Rico
-
 Qatar
Qatar
-
 Reunion
-
 Romania
-
 Rwanda
-
 Saudi Arabia
-
 Serbia
-
 Singapore
-
 Slovakia
-
 Slovenia
-
 Somalia
-
 South Africa
-
 Spain
Spain
-
 Sri Lanka
-
 Sweden
-
 Switzerland
-
 Syria
Syria
-
 Taiwan
-
 Tajikistan
-
 Tanzania
-
 Thailand
-
 Trinidad and Tobago
-
 Tunisia
-
 Turkey
-
 UAE
UAE
-
 Uganda
-
 Ukraine
-
 United Kingdom
-
United States
-
 Uruguay
-
 Uzbekistan
-
 Venezuela
-
 Vietnam
-
 Yemen
Yemen
-
 Zambia
-
 Zimbabwe
- Forex
- Crypto
