
Hedera declines as ADX indicates prevailing bearish pressure: weekly report

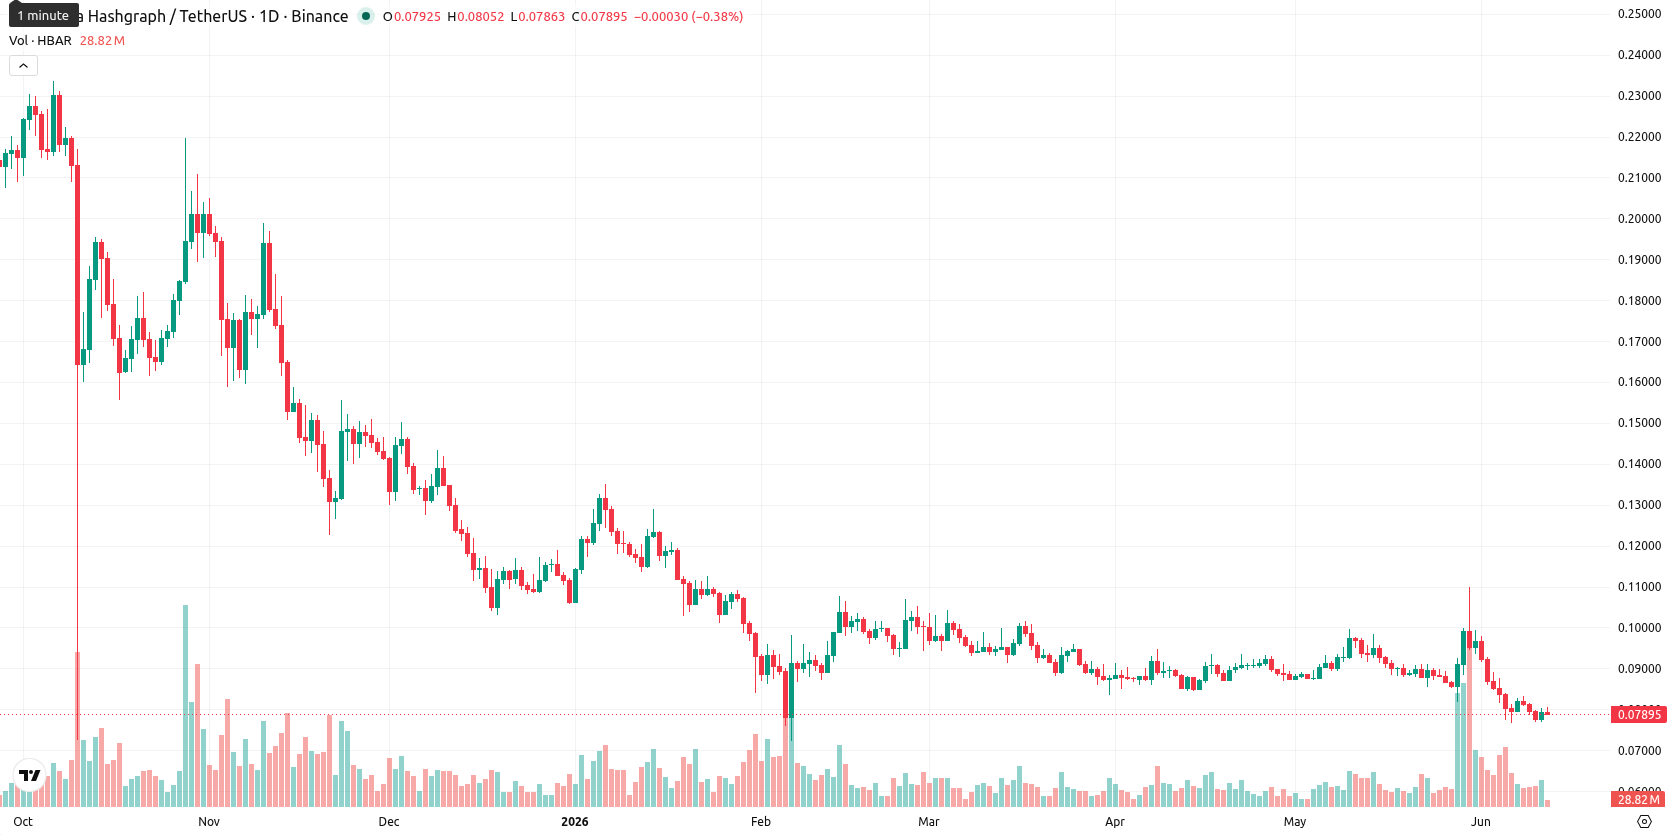
Hedera (HBAR) is trading at $0.079, marking a decline of $0.0020 (2.59%) over the past week and placing the asset well below its weekly MA-20 ($0.0909), MA-50 ($0.1482), and MA-200 ($0.1106). This sustained move beneath all major moving averages indicates continued seller pressure and a firmly bearish positioning on the weekly chart.
Highlights
- HBAR sustains a bearish trend, trading below key moving averages with sellers clearly dominating the price action.
- Momentum indicators collectively signal downside bias, with no buy signals and persistent oversold conditions limiting upside potential.
- HBAR is expected to trade between $0.0722 and $0.0860 over the next week, with further declines more likely than a rebound.
Institutional adoption and regulatory engagement bolster network appeal this week
Real-world asset tokenization on Hedera's platform remains in focus, highlighted by institutional real estate initiatives such as RedSwan CRE, which claims over $5 billion in tokenized property using the network. The Hedera council's enterprise-oriented governance model, featuring organizations including Google, IBM, and Boeing, strengthens its institutional appeal across use cases like bond tokenization and supply chain management. Regulatory engagement has advanced, as shown by participation in industry coalitions engaging with U.S. Senate offices on market structure policy. Ongoing development activity persists, while the network's compliance and carbon-negative status are cited as long-term adoption advantages.
Bearish momentum prevails as weekly technical signals reinforce downside
On the weekly timeframe, HBAR shows persistent downside pressure, with the price holding below all major weekly moving averages (MA-20 at $0.0909, MA-50 at $0.1482, MA-200 at $0.1106). Weekly momentum indicators reinforce this view: the MACD and ADX continue to generate strong sell signals, and RSI remains weak at 36. The CCI reflects oversold conditions, while the Stochastic RSI is neutral, indicating that buying interest has not yet returned. The Awesome Oscillator's neutral reading adds little counter-trend conviction, and continued dominance by sellers is visible in Bull/Bear Power. Key weekly support stands near $0.0722, with dynamic resistance at the MA-20 ($0.0909).
Sideways-to-lower trajectory expected as indicators and volatility weigh on outlook
Over the next 7 days, HBAR is expected to trade primarily between $0.0722 and $0.0860, reflecting both prevailing bearish momentum and recent volatility of 8.75%. The probability of upward price action is low (less than 20%), as none of the four key weekly indicators (RSI, ADX, MACD, CCI) issue a buy signal. The base case scenario suggests sideways-to-lower action within this established range. A bullish shift would require a weekly close above $0.0860, which is unlikely barring a change in current technicals, while increased downside risk could see HBAR test or break below $0.0722 in alignment with the dominant negative momentum.
Previously it was reported that Hedera was exhibiting entrenched bearish momentum, with technical signals indicating a sustained negative trend despite ongoing enterprise developments. This outlook is reinforced by the latest weekly indicators, and traders should closely monitor the $0.0722 support level for signs of either a continued decline or a potential stabilization in price action.


-
 Afghanistan
-
 Albania
-
 Algeria
-
 Angola
-
 Argentina
-
 Armenia
-
 Australia
-
 Austria
-
 Azerbaijan
-
 Bahamas
-
 Bahrain
-
 Bangladesh
-
 Belarus
-
 Belgium
-
 Bolivia
-
 Botswana
-
 Brazil
-
 Brunei
-
 Bulgaria
-
 Cambodia
-
 Cameroon
-
 Canada
-
 Chile
Chile
-
 China
China
-
 Colombia
-
 Congo
Congo
-
 Costa Rica
-
 Cote d'Ivoire
-
 Croatia
-
 Cuba
Cuba
-
 Cyprus
-
 Czechia
-
 DR Congo
-
 Denmark
-
 Dominican Republic
-
 Ecuador
-
 Egypt
Egypt
-
 El Salvador
-
 Estonia
-
 Eswatini
-
 Ethiopia
-
 Finland
-
 France
-
 Georgia
-
 Germany
-
 Ghana
Ghana
-
 Greece
-
 Haiti
Haiti
-
 Hong Kong
-
 Hungary
-
 India
India
-
 Indonesia
-
 Iran, Islamic republic
-
 Iraq
Iraq
-
 Ireland
-
 Israel
-
 Italy
Italy
-
 Jamaica
-
 Japan
Japan
-
 Jordan
-
 Kazakhstan
-
 Kenya
Kenya
-
 Korea
Korea
-
 Kuwait
-
 Kyrgyzstan
-
 Laos
Laos
-
 Latvia
-
 Lebanon
-
 Lesotho
-
 Libya
Libya
-
 Lithuania
-
 Luxembourg
-
 Madagascar
-
 Malaysia
-
 Malta
Malta
-
 Mauritius
-
 Mexico
-
 Moldova
-
 Mongolia
-
 Montenegro
-
 Morocco
-
 Mozambique
-
 Myanmar
-
 Namibia
-
 Nepal
Nepal
-
 Netherlands
-
 New Zealand
-
 Nigeria
-
 North Macedonia
-
 Norway
-
 Oman
Oman
-
 Pakistan
-
 Palestine
-
 Panama
-
 Papua New Guinea
-
 Paraguay
-
 Peru
Peru
-
 Philippines
-
 Poland
-
 Portugal
-
 Puerto Rico
-
 Qatar
Qatar
-
 Reunion
-
 Romania
-
 Rwanda
-
 Saudi Arabia
-
 Serbia
-
 Singapore
-
 Slovakia
-
 Slovenia
-
 Somalia
-
 South Africa
-
 Spain
Spain
-
 Sri Lanka
-
 Sweden
-
 Switzerland
-
 Syria
Syria
-
 Taiwan
-
 Tajikistan
-
 Tanzania
-
 Thailand
-
 Trinidad and Tobago
-
 Tunisia
-
 Turkey
-
 UAE
UAE
-
 Uganda
-
 Ukraine
-
 United Kingdom
-
United States
-
 Uruguay
-
 Uzbekistan
-
 Venezuela
-
 Vietnam
-
 Yemen
Yemen
-
 Zambia
-
 Zimbabwe
- Forex
- Crypto
