
Jito declines as short-term trend favors downside

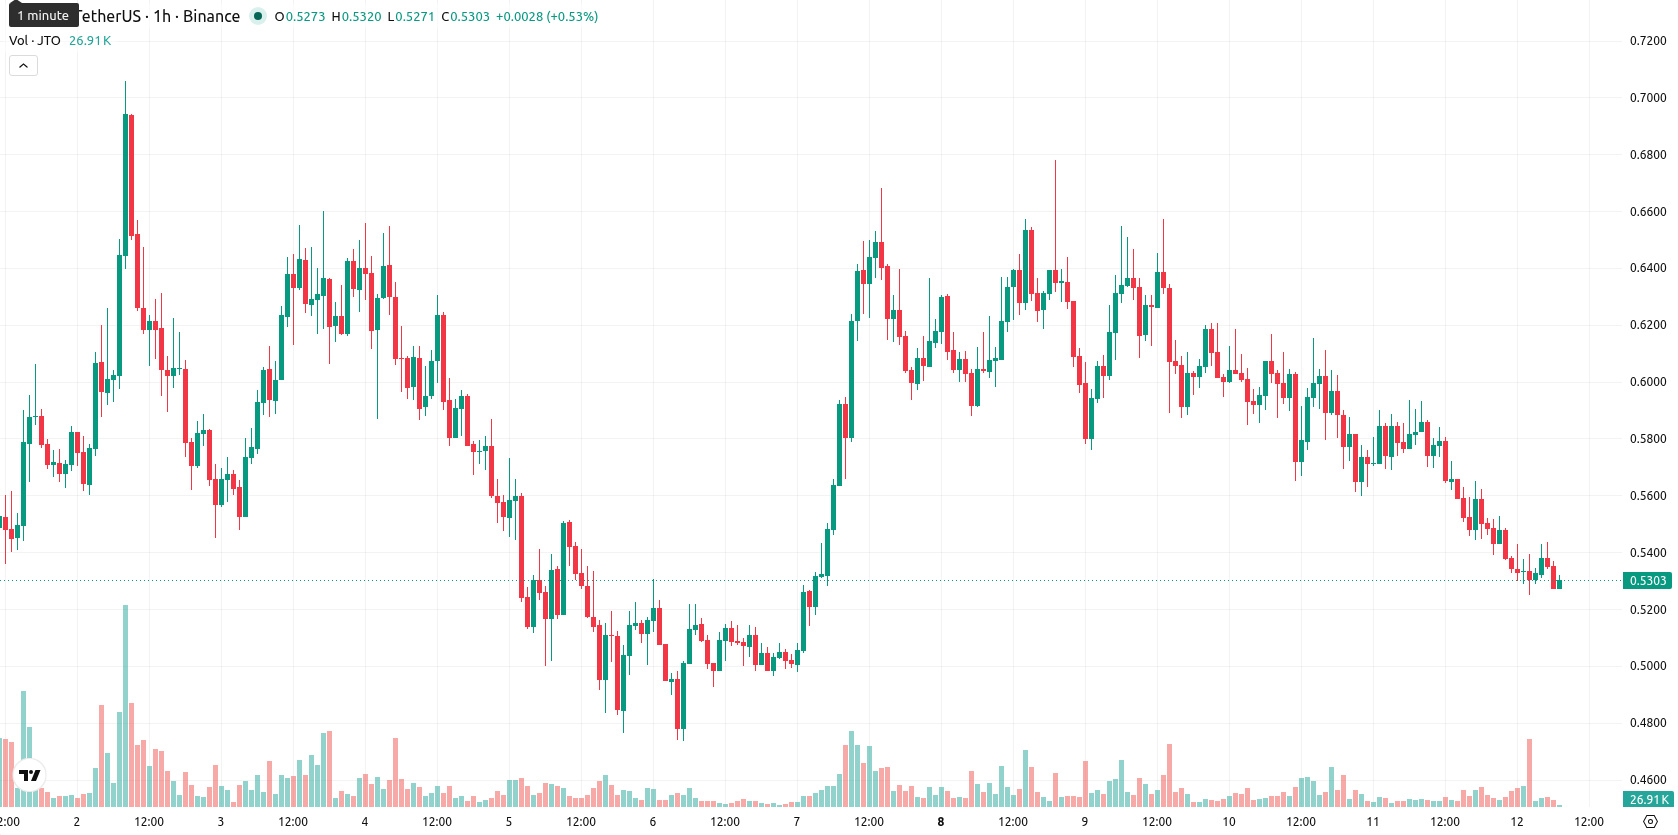
Jito (JTO) is trading at $0.532, recording a daily decline of 9.01%. The asset is currently positioned below its key short- and medium-term moving averages while maintaining support above its longer-term average.
Highlights
- JTO/USD faces persistent bearish momentum, trading below key short- and medium-term moving averages and showing continued selling pressure.
- Price action holds above long-term support but remains volatile, with buyers showing limited activity amid a daily drop of 9.01%.
- JTO/USD is likely to consolidate between $0.4863 and $0.5777 over the next sessions, with significant downside risk if support fails.
Technical gauges tilt bearish as medium-term selling faces longer-term support
The current technical setup shows JTO/USD trading below the MA-20 and MA-50, which reflects ongoing selling pressure over the short to medium term. However, the pair remains above the longer-term MA-200, offering structural support on the daily timeframe. Immediate resistance is established at the Ichimoku Kijun level of $0.5593. Among momentum indicators, MACD issues a strong sell signal while ADX is neutral, indicating the trend strength is not definitively established. RSI stands at 37.67, favoring further selling, and CCI also signals a sell, whereas Stoch RSI remains neutral, signaling an ambiguous oversold condition. The BBP reveals some buyer activity amid a negative gap of 0.0505 and elevated volatility, reflecting a divergence between buyer participation and overall bearish oscillators.
Rangebound outlook persists as downside risks outweigh recovery chances
Over the next two to three sessions, JTO is expected to trade within a range of $0.4863 to $0.5777, which reflects typical volatility relative to current levels. The likelihood of an upside breakout is very low, with prevailing momentum favoring continued downside movement. The base scenario foresees consolidation within this corridor. Should bullish momentum overcome resistance at $0.5593, an upward breakout scenario would be in play, while a decisive move below $0.4863 could lead to an acceleration of the ongoing downtrend.
Earlier, analysts noted that Jito remained under notable downside pressure, with persistent volatility and oversold signals but no clear indication of a reversal. The current article confirms the dominance of bearish momentum, and traders should closely monitor for a definitive move below $0.4863 as a trigger for further downside acceleration.


Latest Jito News


-
 Afghanistan
-
 Albania
-
 Algeria
-
 Angola
-
 Argentina
-
 Armenia
-
 Australia
-
 Austria
-
 Azerbaijan
-
 Bahamas
-
 Bahrain
-
 Bangladesh
-
 Belarus
-
 Belgium
-
 Bolivia
-
 Botswana
-
 Brazil
-
 Brunei
-
 Bulgaria
-
 Cambodia
-
 Cameroon
-
 Canada
-
 Chile
Chile
-
 China
China
-
 Colombia
-
 Congo
Congo
-
 Costa Rica
-
 Cote d'Ivoire
-
 Croatia
-
 Cuba
Cuba
-
 Cyprus
-
 Czechia
-
 DR Congo
-
 Denmark
-
 Dominican Republic
-
 Ecuador
-
 Egypt
Egypt
-
 El Salvador
-
 Estonia
-
 Eswatini
-
 Ethiopia
-
 Finland
-
 France
-
 Georgia
-
 Germany
-
 Ghana
Ghana
-
 Greece
-
 Haiti
Haiti
-
 Hong Kong
-
 Hungary
-
 India
India
-
 Indonesia
-
 Iran, Islamic republic
-
 Iraq
Iraq
-
 Ireland
-
 Israel
-
 Italy
Italy
-
 Jamaica
-
 Japan
Japan
-
 Jordan
-
 Kazakhstan
-
 Kenya
Kenya
-
 Korea
Korea
-
 Kuwait
-
 Kyrgyzstan
-
 Laos
Laos
-
 Latvia
-
 Lebanon
-
 Lesotho
-
 Libya
Libya
-
 Lithuania
-
 Luxembourg
-
 Madagascar
-
 Malaysia
-
 Malta
Malta
-
 Mauritius
-
 Mexico
-
 Moldova
-
 Mongolia
-
 Montenegro
-
 Morocco
-
 Mozambique
-
 Myanmar
-
 Namibia
-
 Nepal
Nepal
-
 Netherlands
-
 New Zealand
-
 Nigeria
-
 North Macedonia
-
 Norway
-
 Oman
Oman
-
 Pakistan
-
 Palestine
-
 Panama
-
 Papua New Guinea
-
 Paraguay
-
 Peru
Peru
-
 Philippines
-
 Poland
-
 Portugal
-
 Puerto Rico
-
 Qatar
Qatar
-
 Reunion
-
 Romania
-
 Rwanda
-
 Saudi Arabia
-
 Serbia
-
 Singapore
-
 Slovakia
-
 Slovenia
-
 Somalia
-
 South Africa
-
 Spain
Spain
-
 Sri Lanka
-
 Sweden
-
 Switzerland
-
 Syria
Syria
-
 Taiwan
-
 Tajikistan
-
 Tanzania
-
 Thailand
-
 Trinidad and Tobago
-
 Tunisia
-
 Turkey
-
 UAE
UAE
-
 Uganda
-
 Ukraine
-
 United Kingdom
-
United States
-
 Uruguay
-
 Uzbekistan
-
 Venezuela
-
 Vietnam
-
 Yemen
Yemen
-
 Zambia
-
 Zimbabwe
- Forex
- Crypto
