
Solana price prediction: Can $67.38 resistance break? SOL trades steady

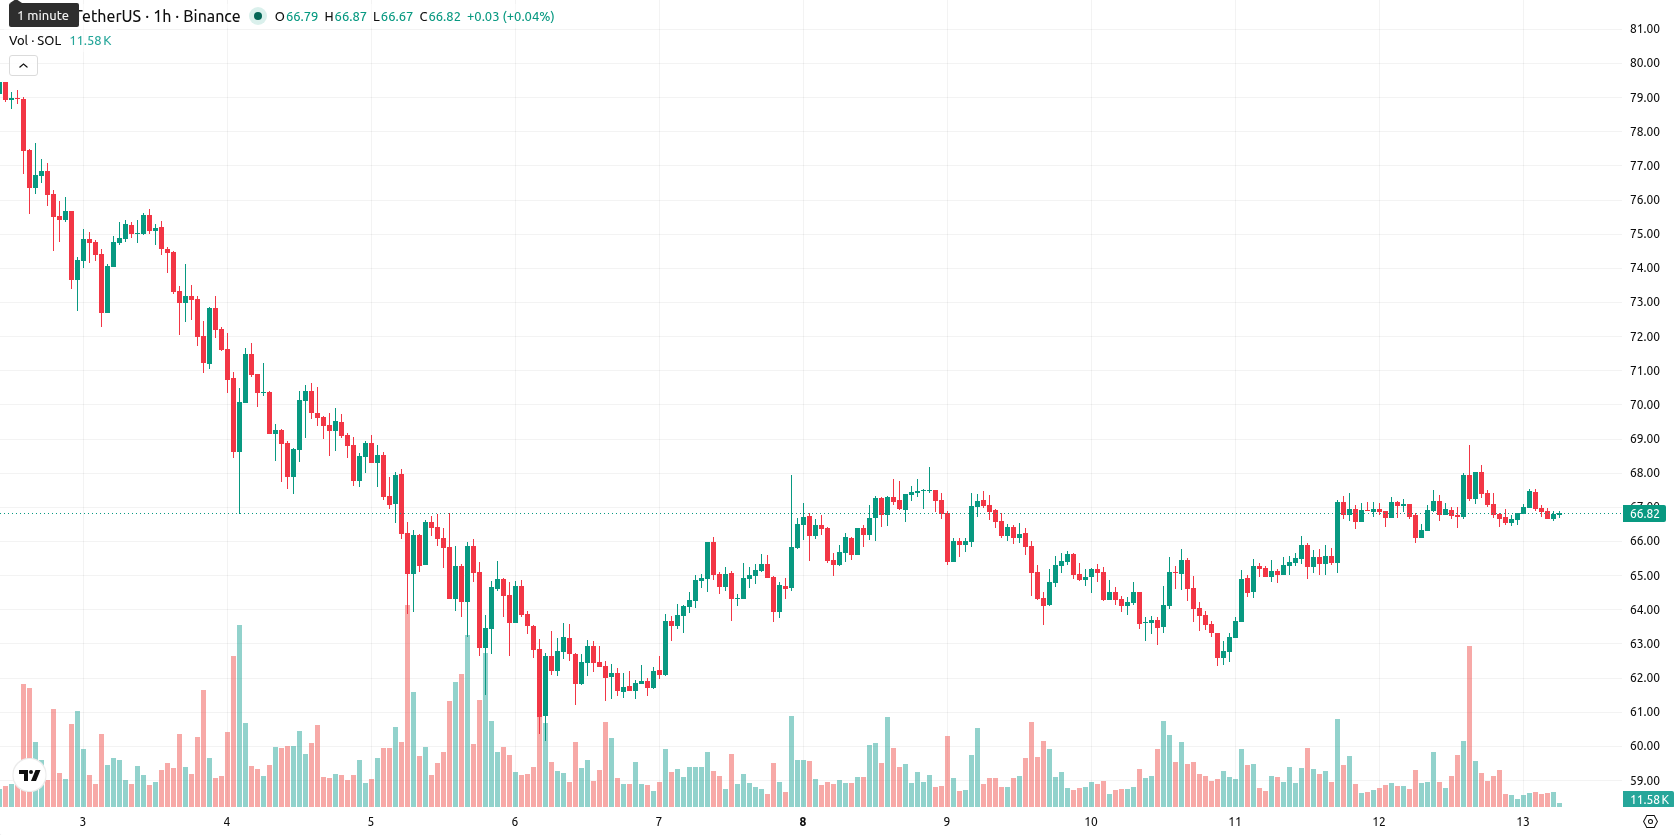
Solana (SOL) is trading at $66.80 after a modest move up of 0.16% on the day, with a session gap of 0.15. The asset is sitting below its short-term moving average cluster but remains above the intermediate trend benchmark, while still well beneath its long-term averages.
Highlights
- Solana Foundation's launch of Frontier Traders aims to attract institutional and professional traders, enhancing network liquidity and capital inflows.
- Recent onboarding of regulated tokenized SpaceX equity trading and a $250 million allocation to a tokenized CLO fund further boost Solana’s utility and credibility.
- SOL/USD is consolidating within a $65.27 to $69.77 range as mixed technical signals point to slight upside probability and moderate volatility.
Institutional inflows accelerate as corporate actions bolster Solana adoption
The recent launch of Frontier Traders by Solana Foundation marks a significant development, creating a dedicated platform to attract institutional and professional traders into the Solana ecosystem. This initiative is expected to boost network liquidity and support further inflows of capital, as it expands infrastructure and accessibility for larger market participants. Additional tailwinds come from the introduction of regulated tokenized SpaceX equity (SPCX) trading on Solana, as covered by finance.yahoo.com and MoneyCheck, and the $250 million planned allocation from Ethena Labs into Securitize’s AAA-rated tokenized CLO fund (STAC) on the network. Together, these corporate actions enhance Solana’s utility and credibility, aligning with the observed upward momentum.
Momentum diverges as buy signals clash with persistent seller pressure
Technically, SOL/USD is trading below the MA-20 but maintains position above the MA-50 on the hourly timeframe, while remaining well under the MA-200. Immediate resistance stands at the Ichimoku Kijun level of $67.38. Hourly support is visible near $65.27 and resistance at $69.77. MACD shows a strong buy signal and the ADX confirms a buying environment, but CCI and BBP both indicate prevailing seller pressure. The RSI is close to neutral at 50.07, with Stoch RSI oversold and AO holding neutral, highlighting notable divergence between momentum and oscillator signals.
Range-bound outlook holds as volatility and upside scenario develop
Over the next 2-3 trading days, SOL/USD is expected to remain within a volatility band between $65.27 and $69.77. The base scenario foresees consolidation inside this range, with a 57% probability favoring an upward break. A move above $67.38 could trigger additional gains toward higher resistance, while a drop below $65.27 would indicate renewed downside risk in the short term.
Earlier, analysts noted that downside risks for Solana had risen due to protocol security concerns and institutional outflows, leaving the asset at a crucial technical juncture. The current expansion of Solana’s institutional infrastructure and tokenized asset offerings introduces potential catalysts for a renewed uptrend, making a decisive move above $67.38 a key level for traders to monitor in the near term.


Latest Solana News


-
 Afghanistan
-
 Albania
-
 Algeria
-
 Angola
-
 Argentina
-
 Armenia
-
 Australia
-
 Austria
-
 Azerbaijan
-
 Bahamas
-
 Bahrain
-
 Bangladesh
-
 Belarus
-
 Belgium
-
 Bolivia
-
 Botswana
-
 Brazil
-
 Brunei
-
 Bulgaria
-
 Cambodia
-
 Cameroon
-
 Canada
-
 Chile
Chile
-
 China
China
-
 Colombia
-
 Congo
Congo
-
 Costa Rica
-
 Cote d'Ivoire
-
 Croatia
-
 Cuba
Cuba
-
 Cyprus
-
 Czechia
-
 DR Congo
-
 Denmark
-
 Dominican Republic
-
 Ecuador
-
 Egypt
Egypt
-
 El Salvador
-
 Estonia
-
 Eswatini
-
 Ethiopia
-
 Finland
-
 France
-
 Georgia
-
 Germany
-
 Ghana
Ghana
-
 Greece
-
 Haiti
Haiti
-
 Hong Kong
-
 Hungary
-
 India
India
-
 Indonesia
-
 Iran, Islamic republic
-
 Iraq
Iraq
-
 Ireland
-
 Israel
-
 Italy
Italy
-
 Jamaica
-
 Japan
Japan
-
 Jordan
-
 Kazakhstan
-
 Kenya
Kenya
-
 Korea
Korea
-
 Kuwait
-
 Kyrgyzstan
-
 Laos
Laos
-
 Latvia
-
 Lebanon
-
 Lesotho
-
 Libya
Libya
-
 Lithuania
-
 Luxembourg
-
 Madagascar
-
 Malaysia
-
 Malta
Malta
-
 Mauritius
-
 Mexico
-
 Moldova
-
 Mongolia
-
 Montenegro
-
 Morocco
-
 Mozambique
-
 Myanmar
-
 Namibia
-
 Nepal
Nepal
-
 Netherlands
-
 New Zealand
-
 Nigeria
-
 North Macedonia
-
 Norway
-
 Oman
Oman
-
 Pakistan
-
 Palestine
-
 Panama
-
 Papua New Guinea
-
 Paraguay
-
 Peru
Peru
-
 Philippines
-
 Poland
-
 Portugal
-
 Puerto Rico
-
 Qatar
Qatar
-
 Reunion
-
 Romania
-
 Rwanda
-
 Saudi Arabia
-
 Serbia
-
 Singapore
-
 Slovakia
-
 Slovenia
-
 Somalia
-
 South Africa
-
 Spain
Spain
-
 Sri Lanka
-
 Sweden
-
 Switzerland
-
 Syria
Syria
-
 Taiwan
-
 Tajikistan
-
 Tanzania
-
 Thailand
-
 Trinidad and Tobago
-
 Tunisia
-
 Turkey
-
 UAE
UAE
-
 Uganda
-
 Ukraine
-
 United Kingdom
-
United States
-
 Uruguay
-
 Uzbekistan
-
 Venezuela
-
 Vietnam
-
 Yemen
Yemen
-
 Zambia
-
 Zimbabwe
- Forex
- Crypto
