
Bitcoin edges higher as Trump cancels Iran strikes

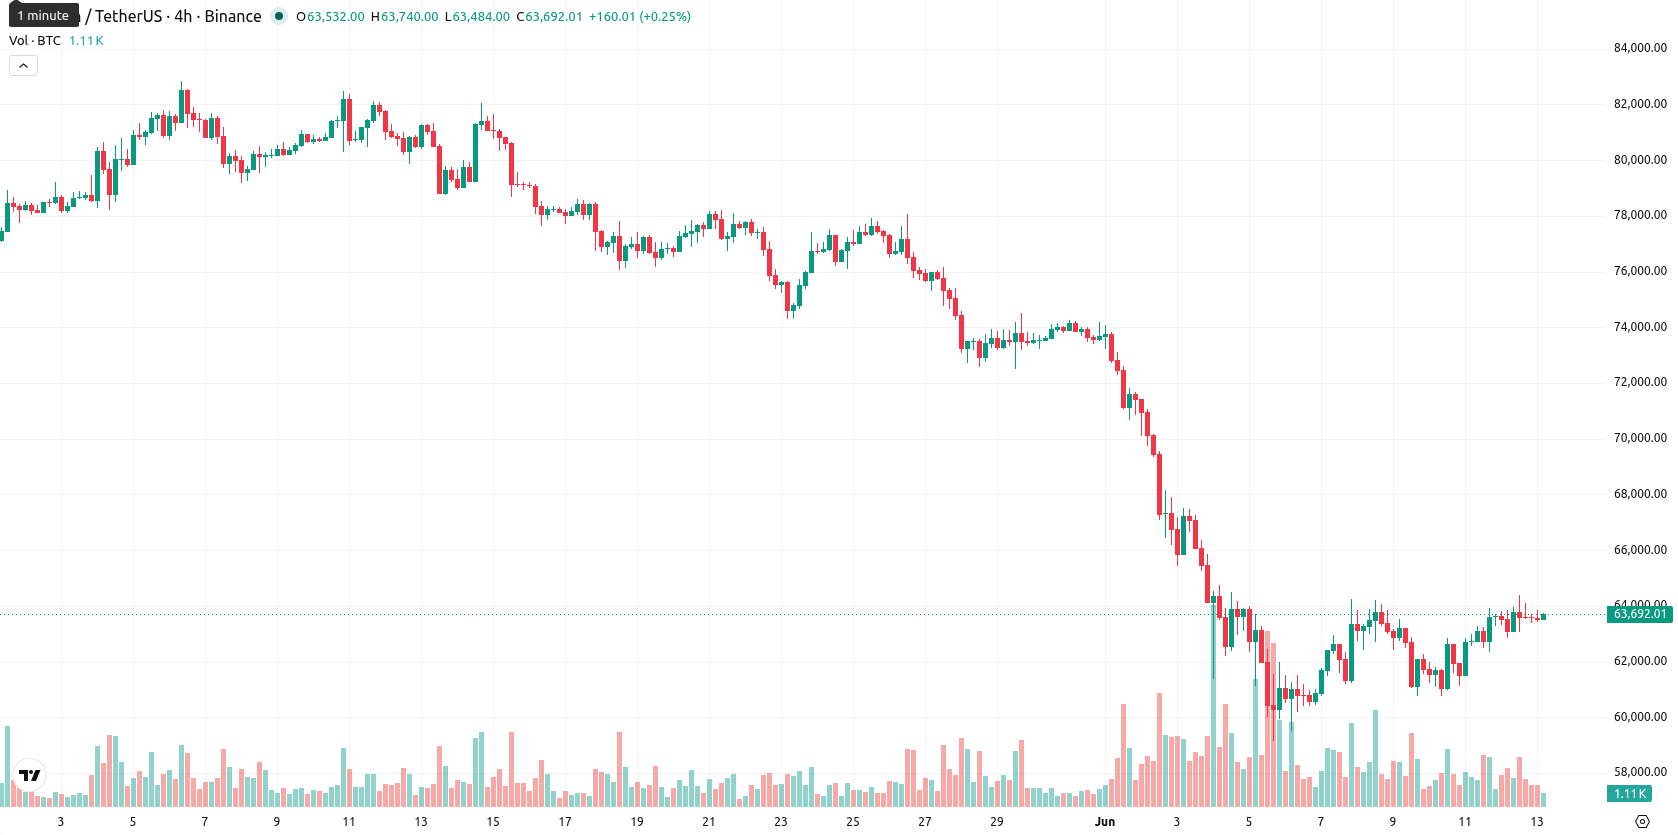
Bitcoin (BTC) is trading at $63,706.44, up 1.03% for the day. The asset is currently positioned above its key short- and medium-term moving averages, reflecting firm intraday momentum.
Highlights
- U.S. military strikes against Iran and subsequent de-escalation triggered sharp volatility in Bitcoin, amid increased geopolitical uncertainty.
- Ongoing regulatory action, including U.S. asset freezes tied to Iranian sanctions evasion, signals persistent oversight despite peace negotiations.
- Technicals show Bitcoin consolidating between $62,074.81 and $66,556.00, with mixed momentum and a slight downside probability in the near term.
Price surge and volatility as geopolitical risk collides with regulation
On June 12, U.S. military strikes against Iran sharply heightened geopolitical risk, causing instability across crypto markets and repressing risk appetite, with Bitcoin whipsawing near multi-month lows as investors responded to the escalation according to Foreign Policy Journal. Later the same day, President Trump cancelled planned military strikes as ceasefire discussions advanced, leading to a sharp Bitcoin rally approaching $74,000 while underlying regulatory pressure intensified as U.S. authorities froze hundreds of millions of dollars in digital assets tied to Iranian sanctions evasion, indicating ongoing scrutiny regardless of diplomatic progress, as reported by Crypto Briefing. Despite announcements of a U.S.-Iran peace deal on June 12, Tehran continued to block the Strait of Hormuz, sustaining elevated oil and inflation risks and reinforcing macroeconomic pressure on Bitcoin's valuation, according to news.bitcoin.com.
Mixed momentum signals as bitcoin tests above short-term supports
On the technical front, BTC/USD is trading above the MA-20 and MA-50 but remains below the MA-200 on the daily chart. The Ichimoku Kijun sits at $62,574.72, acting as immediate support. Momentum signals are mixed: MACD flashes a buy signal, while ADX points to weak trend strength. RSI stands at 54.46 (Buy), CCI issues a Buy, and both Stoch RSI and Bull/Bear Power (BBP) are overbought, signaling strong intraday buyer momentum. The Awesome Oscillator remains neutral, highlighting divergence among bullish and cautious signals.
Sideways trading expected as breakout risks remain balanced
Over the next several days, BTC/USD is expected to consolidate within the $62,074.81 to $66,556.00 range, representing a typical volatility band relative to current levels. The odds of an upward breakout above $66,556.00 are assessed at 48%, with a slightly higher probability for a push below the $62,074.81 support. The baseline outlook calls for continued sideways movement, with a bullish scenario marked by sustained buying lifting the price above resistance, while a bearish reversal could send BTC/USD below near-term support.
Earlier, analysts noted that Bitcoin faced mixed technical signals alongside heightened volatility driven by institutional outflows and market uncertainty. The current environment, with strong intraday momentum but conflicting geopolitical and regulatory pressures, suggests traders should watch for a decisive breakout above $66,556 or a breakdown below $62,074.81 as cues for the next directional move.


Latest Bitcoin News


-
 Afghanistan
-
 Albania
-
 Algeria
-
 Angola
-
 Argentina
-
 Armenia
-
 Australia
-
 Austria
-
 Azerbaijan
-
 Bahamas
-
 Bahrain
-
 Bangladesh
-
 Belarus
-
 Belgium
-
 Bolivia
-
 Botswana
-
 Brazil
-
 Brunei
-
 Bulgaria
-
 Cambodia
-
 Cameroon
-
 Canada
-
 Chile
Chile
-
 China
China
-
 Colombia
-
 Congo
Congo
-
 Costa Rica
-
 Cote d'Ivoire
-
 Croatia
-
 Cuba
Cuba
-
 Cyprus
-
 Czechia
-
 DR Congo
-
 Denmark
-
 Dominican Republic
-
 Ecuador
-
 Egypt
Egypt
-
 El Salvador
-
 Estonia
-
 Eswatini
-
 Ethiopia
-
 Finland
-
 France
-
 Georgia
-
 Germany
-
 Ghana
Ghana
-
 Greece
-
 Haiti
Haiti
-
 Hong Kong
-
 Hungary
-
 India
India
-
 Indonesia
-
 Iran, Islamic republic
-
 Iraq
Iraq
-
 Ireland
-
 Israel
-
 Italy
Italy
-
 Jamaica
-
 Japan
Japan
-
 Jordan
-
 Kazakhstan
-
 Kenya
Kenya
-
 Korea
Korea
-
 Kuwait
-
 Kyrgyzstan
-
 Laos
Laos
-
 Latvia
-
 Lebanon
-
 Lesotho
-
 Libya
Libya
-
 Lithuania
-
 Luxembourg
-
 Madagascar
-
 Malaysia
-
 Malta
Malta
-
 Mauritius
-
 Mexico
-
 Moldova
-
 Mongolia
-
 Montenegro
-
 Morocco
-
 Mozambique
-
 Myanmar
-
 Namibia
-
 Nepal
Nepal
-
 Netherlands
-
 New Zealand
-
 Nigeria
-
 North Macedonia
-
 Norway
-
 Oman
Oman
-
 Pakistan
-
 Palestine
-
 Panama
-
 Papua New Guinea
-
 Paraguay
-
 Peru
Peru
-
 Philippines
-
 Poland
-
 Portugal
-
 Puerto Rico
-
 Qatar
Qatar
-
 Reunion
-
 Romania
-
 Rwanda
-
 Saudi Arabia
-
 Serbia
-
 Singapore
-
 Slovakia
-
 Slovenia
-
 Somalia
-
 South Africa
-
 Spain
Spain
-
 Sri Lanka
-
 Sweden
-
 Switzerland
-
 Syria
Syria
-
 Taiwan
-
 Tajikistan
-
 Tanzania
-
 Thailand
-
 Trinidad and Tobago
-
 Tunisia
-
 Turkey
-
 UAE
UAE
-
 Uganda
-
 Ukraine
-
 United Kingdom
-
United States
-
 Uruguay
-
 Uzbekistan
-
 Venezuela
-
 Vietnam
-
 Yemen
Yemen
-
 Zambia
-
 Zimbabwe
- Forex
- Crypto
