
Gala pushes higher as buying pressure dominates intraday trade

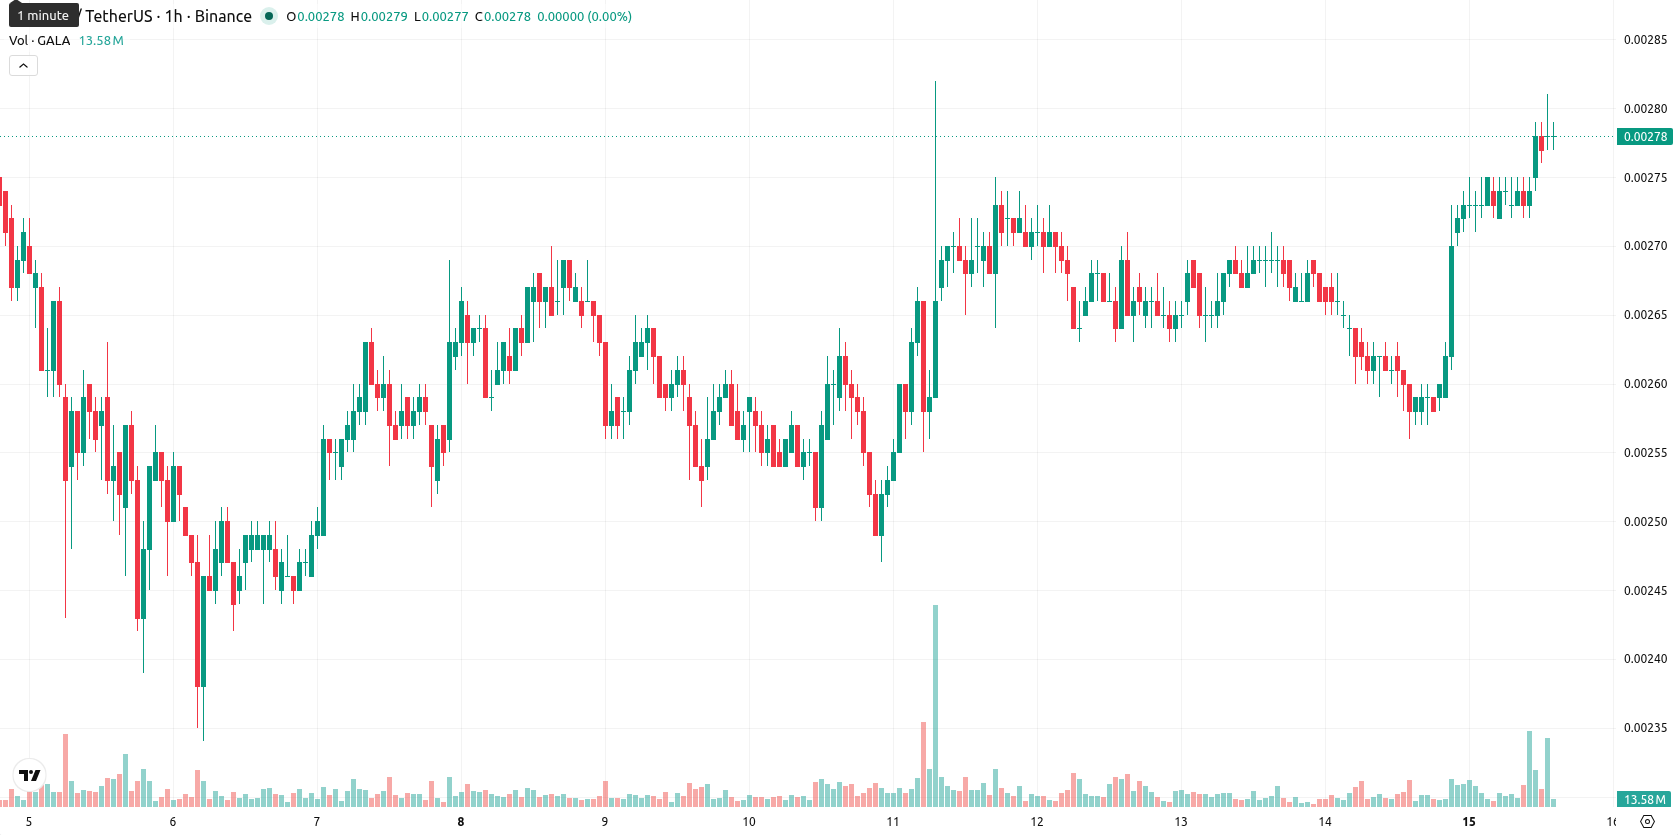
Gala (GALA) is trading at $0.00278, up 6.92% on the day. The asset sits above its key short- and medium-term moving averages while still remaining below its longer-term trend benchmarks.
Highlights
- GALA is exhibiting strong short- and medium-term bullish momentum, trading above recent moving averages on intraday charts.
- Overbought conditions across multiple indicators signal elevated upside risk, with buyers dominating but potential for a near-term pullback.
- Price is expected to consolidate between $0.00270000 and $0.00285826 over the next 2–3 days, with high breakout probability above resistance.
Upside momentum builds as overbought signals intensify
On the h1 timeframe, GALA/USD trades above the MA-20 ($0.00271850) and MA-50 ($0.00267320), but remains below the MA-200 ($0.00449320) on the daily chart. The Ichimoku Kijun line at $0.00268500 acts as immediate support. Momentum indicators are strong, with the MACD and ADX in Buy mode. RSI stands at 71.11 and, along with Stoch RSI in Buy and CCI in Overbought, indicates a stretched market to the upside. The BBP continues to show buyer dominance in the intraday session, and the Awesome Oscillator aligns with the upward price trend. There is no meaningful divergence among the indicators, but overbought readings warrant caution.
Rangebound consolidation likely as price nears key thresholds
For the next 2–3 trading days, GALA is expected to fluctuate within the $0.00270000 to $0.00285826 range, reflecting a typical volatility band relative to current levels. The most probable scenario is a consolidation within this corridor. Should the price break above resistance, further gains beyond the upper end of the range may develop. Conversely, a move below the support level could trigger a corrective pullback and pave the way for deeper short-term declines.
Earlier, analysts noted that Gala was experiencing short-term bullish momentum while cautioning that overbought conditions could lead to a near-term pause or correction. With current readings confirming sustained upside pressure but signaling even more stretched momentum, traders should be alert for sudden volatility outside the current consolidation band, which could quickly intensify either to the upside or trigger a rapid reversal.


Latest Gala News


-
 Afghanistan
-
 Albania
-
 Algeria
-
 Angola
-
 Argentina
-
 Armenia
-
 Australia
-
 Austria
-
 Azerbaijan
-
 Bahamas
-
 Bahrain
-
 Bangladesh
-
 Belarus
-
 Belgium
-
 Bolivia
-
 Botswana
-
 Brazil
-
 Brunei
-
 Bulgaria
-
 Cambodia
-
 Cameroon
-
 Canada
-
 Chile
Chile
-
 China
China
-
 Colombia
-
 Congo
Congo
-
 Costa Rica
-
 Cote d'Ivoire
-
 Croatia
-
 Cuba
Cuba
-
 Cyprus
-
 Czechia
-
 DR Congo
-
 Denmark
-
 Dominican Republic
-
 Ecuador
-
 Egypt
Egypt
-
 El Salvador
-
 Estonia
-
 Eswatini
-
 Ethiopia
-
 Finland
-
 France
-
 Georgia
-
 Germany
-
 Ghana
Ghana
-
 Greece
-
 Haiti
Haiti
-
 Hong Kong
-
 Hungary
-
 India
India
-
 Indonesia
-
 Iran, Islamic republic
-
 Iraq
Iraq
-
 Ireland
-
 Israel
-
 Italy
Italy
-
 Jamaica
-
 Japan
Japan
-
 Jordan
-
 Kazakhstan
-
 Kenya
Kenya
-
 Korea
Korea
-
 Kuwait
-
 Kyrgyzstan
-
 Laos
Laos
-
 Latvia
-
 Lebanon
-
 Lesotho
-
 Libya
Libya
-
 Lithuania
-
 Luxembourg
-
 Madagascar
-
 Malaysia
-
 Malta
Malta
-
 Mauritius
-
 Mexico
-
 Moldova
-
 Mongolia
-
 Montenegro
-
 Morocco
-
 Mozambique
-
 Myanmar
-
 Namibia
-
 Nepal
Nepal
-
 Netherlands
-
 New Zealand
-
 Nigeria
-
 North Macedonia
-
 Norway
-
 Oman
Oman
-
 Pakistan
-
 Palestine
-
 Panama
-
 Papua New Guinea
-
 Paraguay
-
 Peru
Peru
-
 Philippines
-
 Poland
-
 Portugal
-
 Puerto Rico
-
 Qatar
Qatar
-
 Reunion
-
 Romania
-
 Rwanda
-
 Saudi Arabia
-
 Serbia
-
 Singapore
-
 Slovakia
-
 Slovenia
-
 Somalia
-
 South Africa
-
 Spain
Spain
-
 Sri Lanka
-
 Sweden
-
 Switzerland
-
 Syria
Syria
-
 Taiwan
-
 Tajikistan
-
 Tanzania
-
 Thailand
-
 Trinidad and Tobago
-
 Tunisia
-
 Turkey
-
 UAE
UAE
-
 Uganda
-
 Ukraine
-
 United Kingdom
-
United States
-
 Uruguay
-
 Uzbekistan
-
 Venezuela
-
 Vietnam
-
 Yemen
Yemen
-
 Zambia
-
 Zimbabwe
- Forex
- Crypto
