
Lackluster upside momentum pushes Solana down 4.06%

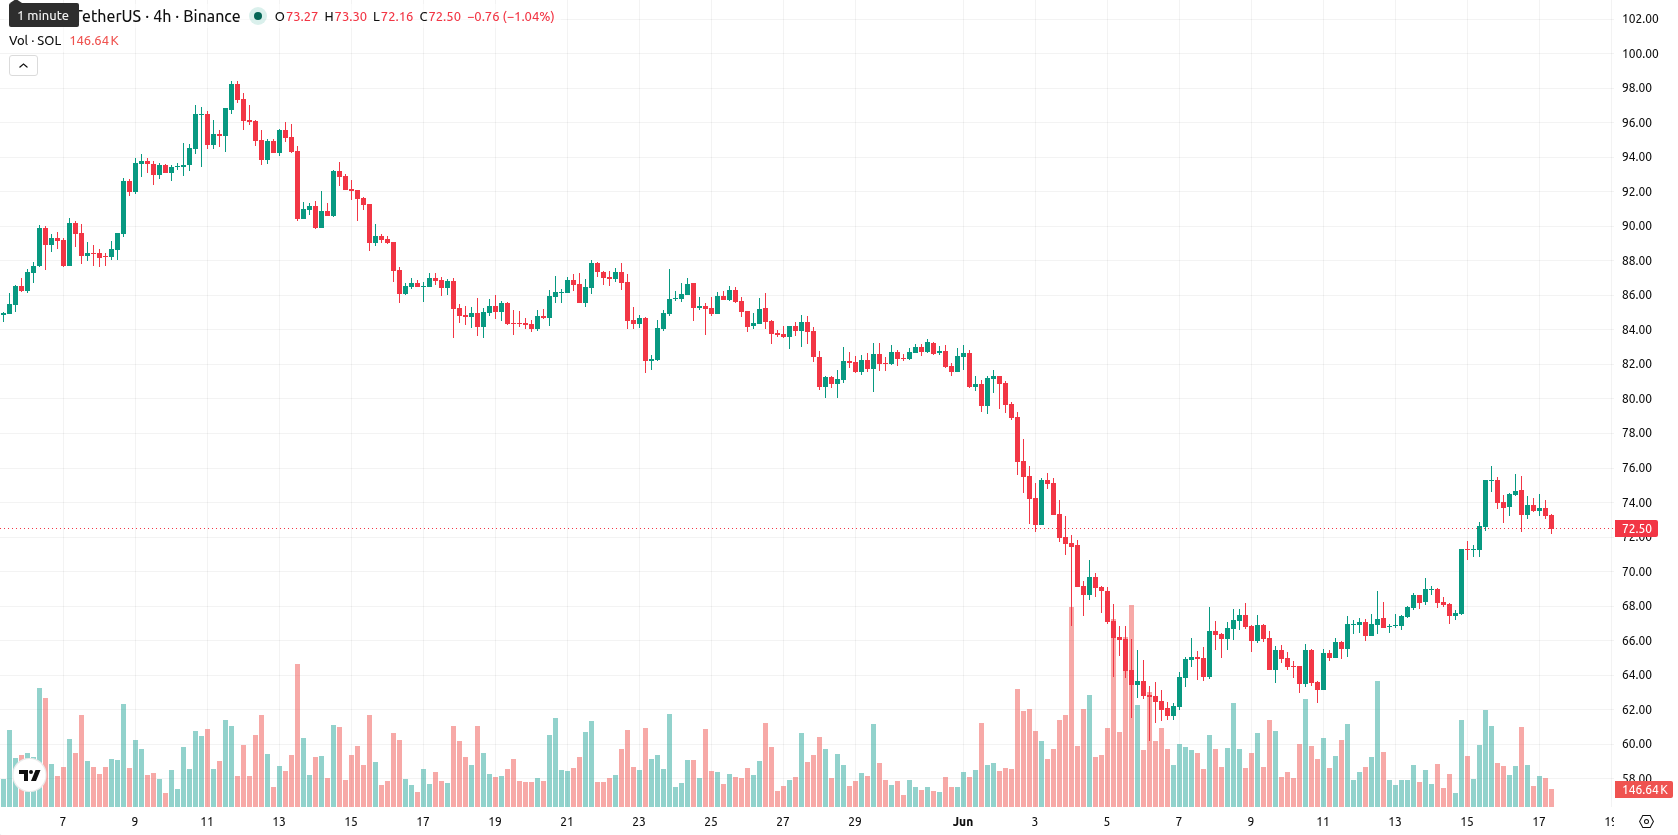
Solana (SOL) is trading at $72.34, down 4.06% on the day. The asset sits above its key short- and medium-term moving averages but remains below longer-term trend levels.
Highlights
- Improved risk sentiment following eased US-Iran tensions led to increased demand for Solana and broader crypto market optimism.
- Market attention is shifting to the Federal Reserve's impending rate decision and the positioning of its new chairman, though overall price action remains pressured.
- SOL is forecast to trade between $66.57 and $79.13, with mixed technical signals and a slight upward bias in the near term.
Improved risk appetite and Fed outlook bolster crypto demand
The easing of tensions between the United States and Iran resulted in improved risk sentiment and a decline in oil prices, leading to a period of stronger demand for Solana. This shift contributed to broader market optimism, with crypto assets benefiting as risk appetite improved. Market focus has also begun to shift toward the Federal Reserve's approaching interest rate decision and the stance of its new chairman, though price action has remained under broader selling pressure.
Mixed momentum signals as intraday overbought counters longer-term weakness
The 4-hour chart shows SOL trading above the MA-20 and MA-50, while the daily chart places it well below the MA-200. The Ichimoku Kijun at $71.34 serves as immediate support. MACD on the current setup registers a Strong Buy, and ADX indicates a Buy, but Stoch RSI is in oversold territory. The RSI reads 60.8, suggesting bullish momentum, whereas CCI is neutral. Bull/Bear Power (BBP) displays overbought conditions intraday, and the Awesome Oscillator is neutral, showing a lack of confirmation for the prevailing trend.
Mild bullish tilt as price faces key breakout thresholds
In the short-term, price is expected to fluctuate within the $66.57 to $79.13 range, marking a typical volatility band relative to current levels. The probability of an upward move modestly outweighs the downside risk, with a 52% chance for gains versus a 48% chance for declines. A breakout above $79.13 would signal a bullish scenario, while a fall below $66.57 opens the door to further downside. Sideways price action would likely see SOL consolidate between these boundaries.
Earlier, analysts noted that a slowdown in Pump.fun activity contributed to declining revenue and engagement within the broader Solana ecosystem. With improved risk sentiment and technical indicators showing bullish momentum, traders should monitor for a potential breakout above $79.13 as confirmation of a sustained upward move in SOL.


Latest Solana News


-
 Afghanistan
-
 Albania
-
 Algeria
-
 Angola
-
 Argentina
-
 Armenia
-
 Australia
-
 Austria
-
 Azerbaijan
-
 Bahamas
-
 Bahrain
-
 Bangladesh
-
 Belarus
-
 Belgium
-
 Bolivia
-
 Botswana
-
 Brazil
-
 Brunei
-
 Bulgaria
-
 Cambodia
-
 Cameroon
-
 Canada
-
 Chile
Chile
-
 China
China
-
 Colombia
-
 Congo
Congo
-
 Costa Rica
-
 Cote d'Ivoire
-
 Croatia
-
 Cuba
Cuba
-
 Cyprus
-
 Czechia
-
 DR Congo
-
 Denmark
-
 Dominican Republic
-
 Ecuador
-
 Egypt
Egypt
-
 El Salvador
-
 Estonia
-
 Eswatini
-
 Ethiopia
-
 Finland
-
 France
-
 Georgia
-
 Germany
-
 Ghana
Ghana
-
 Greece
-
 Haiti
Haiti
-
 Hong Kong
-
 Hungary
-
 India
India
-
 Indonesia
-
 Iran, Islamic republic
-
 Iraq
Iraq
-
 Ireland
-
 Israel
-
 Italy
Italy
-
 Jamaica
-
 Japan
Japan
-
 Jordan
-
 Kazakhstan
-
 Kenya
Kenya
-
 Korea
Korea
-
 Kuwait
-
 Kyrgyzstan
-
 Laos
Laos
-
 Latvia
-
 Lebanon
-
 Lesotho
-
 Libya
Libya
-
 Lithuania
-
 Luxembourg
-
 Madagascar
-
 Malaysia
-
 Malta
Malta
-
 Mauritius
-
 Mexico
-
 Moldova
-
 Mongolia
-
 Montenegro
-
 Morocco
-
 Mozambique
-
 Myanmar
-
 Namibia
-
 Nepal
Nepal
-
 Netherlands
-
 New Zealand
-
 Nigeria
-
 North Macedonia
-
 Norway
-
 Oman
Oman
-
 Pakistan
-
 Palestine
-
 Panama
-
 Papua New Guinea
-
 Paraguay
-
 Peru
Peru
-
 Philippines
-
 Poland
-
 Portugal
-
 Puerto Rico
-
 Qatar
Qatar
-
 Reunion
-
 Romania
-
 Rwanda
-
 Saudi Arabia
-
 Serbia
-
 Singapore
-
 Slovakia
-
 Slovenia
-
 Somalia
-
 South Africa
-
 Spain
Spain
-
 Sri Lanka
-
 Sweden
-
 Switzerland
-
 Syria
Syria
-
 Taiwan
-
 Tajikistan
-
 Tanzania
-
 Thailand
-
 Trinidad and Tobago
-
 Tunisia
-
 Turkey
-
 UAE
UAE
-
 Uganda
-
 Ukraine
-
 United Kingdom
-
United States
-
 Uruguay
-
 Uzbekistan
-
 Venezuela
-
 Vietnam
-
 Yemen
Yemen
-
 Zambia
-
 Zimbabwe
- Forex
- Crypto
