
Solana price prediction: $70.86 support in focus as SOL trades sideways

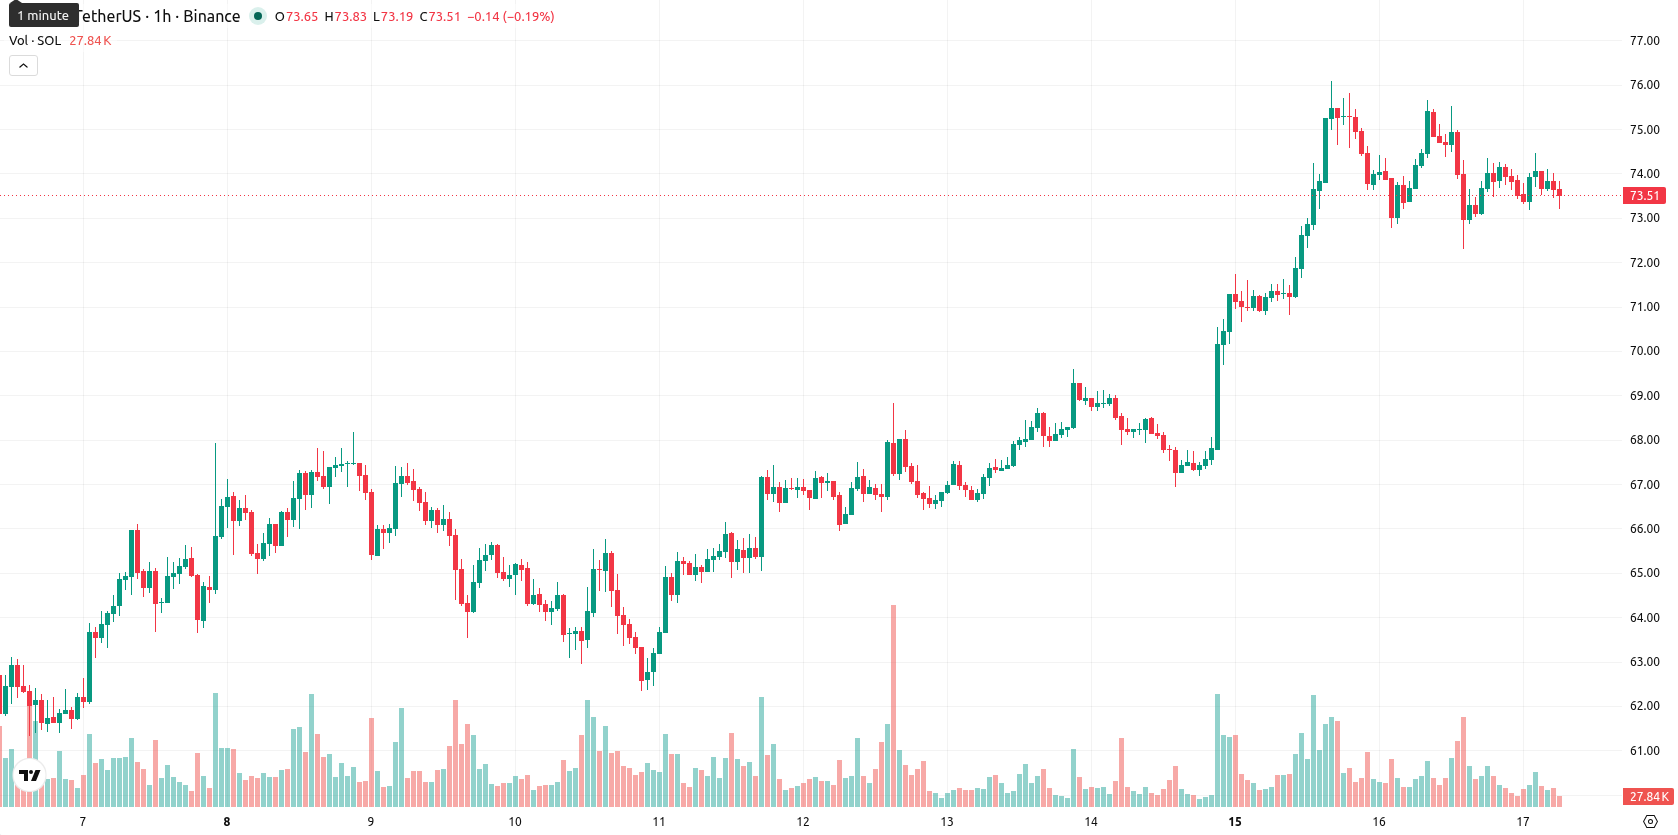
Solana (SOL) is trading at $73.74, down 0.16% for the day and holding mid-range within the session. The asset currently sits below its key short-term moving averages, reflecting moderate volatility.
Highlights
- Solana Company rejected Forward Industries' takeover bid, preserving its independence amid consolidation pressures in the sector.
- Spot Solana ETFs posted $2.81 million in net inflows, while tokenized products and large allocations signal renewed institutional engagement.
- SOL trades below major moving averages under persistent bearish bias, with price expected to consolidate between $70.86 and $76.62 short term.
Institutional inflows and rejection of takeover proposal drive renewed interest
Solana Company rejected a non-binding acquisition proposal from Forward Industries on June 15, preserving operational independence in the face of consolidation pressures. Spot Solana ETFs recorded $2.81 million in net inflows on Monday, reversing outflows from the prior week and indicating renewed institutional and retail interest, according to SoSoValue. At the same time, Securitize introduced its tokenized AAA CLO fund to the Solana blockchain, and Ethena Labs signaled plans for a $250 million allocation, while regulatory advocacy from the Solana Institute continued in Washington — though price action has remained under broader selling pressure.
Mixed oscillator signals as Solana tests resistance under moving averages
On the H1 timeframe, SOL/USD is trading below the MA-20 but just above the MA-50, while it stays well under the MA-200. Notably, immediate resistance is defined at $73.97 by the Ichimoku Kijun line. MACD readings display strong bullish momentum; the ADX remains neutral, suggesting a lack of dominant trend strength. The RSI is at 51.5, reflecting mildly positive momentum and a potential bullish bias, while CCI and Stoch RSI are neutral, indicating neither overbought nor oversold conditions. Bull/Bear Power (BBP) highlights strong intraday buyer interest, but the Awesome Oscillator is neutral. Oscillators overall are mixed, producing moderate divergence and a mildly cautious outlook.
Upside favored if resistance breaks amid consolidation risk
Over the next one to three days, SOL/USD is likely to consolidate between $70.86 and $76.62, reflecting typical volatility for the asset’s current levels. Market probabilities point to a 61% chance of an upward move versus a 39% probability of downside. If SOL/USD breaks above the $73.97 resistance, further upside momentum could develop. Conversely, a loss of support near $70.86 would increase the risk of a bearish scenario.
Earlier, analysts noted that Solana's price action was largely guided by momentum-driven trading and ongoing regulatory uncertainty, which limited broader institutional participation. The current combination of renewed spot ETF inflows, on-chain developments, and continued regulatory advocacy introduces fresh catalysts, making a decisive move above the $73.97 resistance a key signal for potential upside acceleration in the near term.


Latest Solana News


-
 Afghanistan
-
 Albania
-
 Algeria
-
 Angola
-
 Argentina
-
 Armenia
-
 Australia
-
 Austria
-
 Azerbaijan
-
 Bahamas
-
 Bahrain
-
 Bangladesh
-
 Belarus
-
 Belgium
-
 Bolivia
-
 Botswana
-
 Brazil
-
 Brunei
-
 Bulgaria
-
 Cambodia
-
 Cameroon
-
 Canada
-
 Chile
Chile
-
 China
China
-
 Colombia
-
 Congo
Congo
-
 Costa Rica
-
 Cote d'Ivoire
-
 Croatia
-
 Cuba
Cuba
-
 Cyprus
-
 Czechia
-
 DR Congo
-
 Denmark
-
 Dominican Republic
-
 Ecuador
-
 Egypt
Egypt
-
 El Salvador
-
 Estonia
-
 Eswatini
-
 Ethiopia
-
 Finland
-
 France
-
 Georgia
-
 Germany
-
 Ghana
Ghana
-
 Greece
-
 Haiti
Haiti
-
 Hong Kong
-
 Hungary
-
 India
India
-
 Indonesia
-
 Iran, Islamic republic
-
 Iraq
Iraq
-
 Ireland
-
 Israel
-
 Italy
Italy
-
 Jamaica
-
 Japan
Japan
-
 Jordan
-
 Kazakhstan
-
 Kenya
Kenya
-
 Korea
Korea
-
 Kuwait
-
 Kyrgyzstan
-
 Laos
Laos
-
 Latvia
-
 Lebanon
-
 Lesotho
-
 Libya
Libya
-
 Lithuania
-
 Luxembourg
-
 Madagascar
-
 Malaysia
-
 Malta
Malta
-
 Mauritius
-
 Mexico
-
 Moldova
-
 Mongolia
-
 Montenegro
-
 Morocco
-
 Mozambique
-
 Myanmar
-
 Namibia
-
 Nepal
Nepal
-
 Netherlands
-
 New Zealand
-
 Nigeria
-
 North Macedonia
-
 Norway
-
 Oman
Oman
-
 Pakistan
-
 Palestine
-
 Panama
-
 Papua New Guinea
-
 Paraguay
-
 Peru
Peru
-
 Philippines
-
 Poland
-
 Portugal
-
 Puerto Rico
-
 Qatar
Qatar
-
 Reunion
-
 Romania
-
 Rwanda
-
 Saudi Arabia
-
 Serbia
-
 Singapore
-
 Slovakia
-
 Slovenia
-
 Somalia
-
 South Africa
-
 Spain
Spain
-
 Sri Lanka
-
 Sweden
-
 Switzerland
-
 Syria
Syria
-
 Taiwan
-
 Tajikistan
-
 Tanzania
-
 Thailand
-
 Trinidad and Tobago
-
 Tunisia
-
 Turkey
-
 UAE
UAE
-
 Uganda
-
 Ukraine
-
 United Kingdom
-
United States
-
 Uruguay
-
 Uzbekistan
-
 Venezuela
-
 Vietnam
-
 Yemen
Yemen
-
 Zambia
-
 Zimbabwe
- Forex
- Crypto
