
Solana price prediction: Will $66.54 support hold as SOL drops 3.45%?

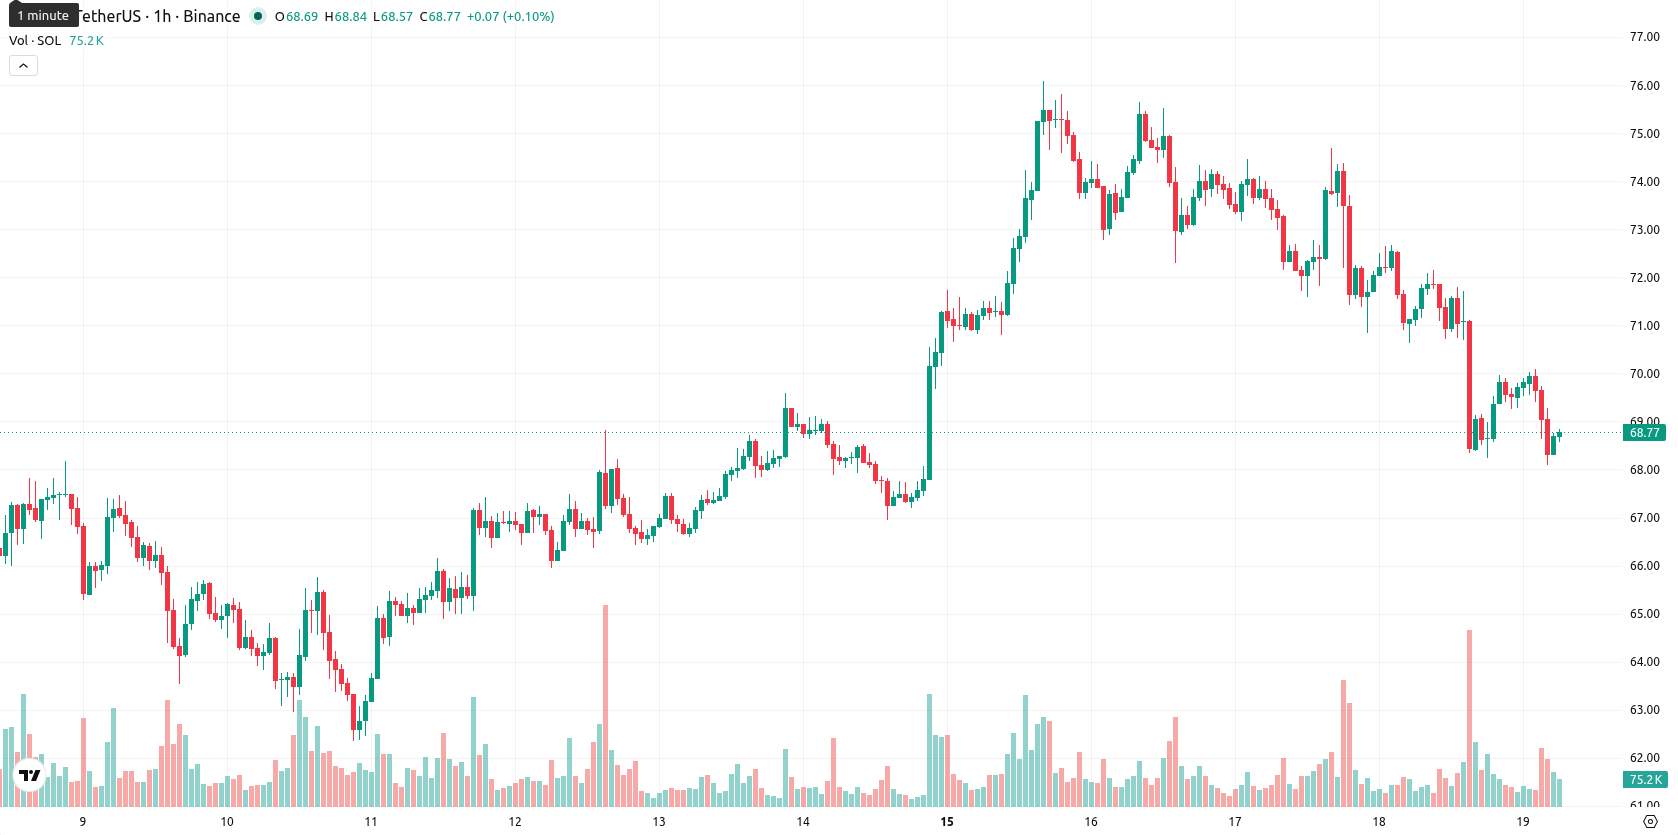
Solana (SOL) is trading at $68.66, down 3.45% on the day with a gap lower at the open and currently sits near the day's lows. The intraday move places the asset below its key short- and medium-term moving averages, with continued seller pressure.
Highlights
- Morgan Stanley updated its Solana ETF filing to include a 95% staking reward retention structure and lowered the sponsor fee to 0.14%, marking the lowest in the market.
- Moody’s Ratings launched live, machine-readable credit ratings on the Solana blockchain, establishing a first for major public blockchains and enhancing institutional appeal.
- Solana faces sustained selling pressure, trades below key technical levels, and is likely to remain within a $66.54–$70.78 range with high downside risk.
ETF updates and credit rating moves offset by persistent selling
Morgan Stanley has submitted a second amended filing for its Ethereum and Solana ETFs to the U.S. SEC, updating the Solana ETF to include a staking model that retains 95% of staking rewards within the trust and lowers the sponsor fee to 0.14%, which is the lowest in the Solana ETF market, according to Theblock. Moody’s Ratings also deployed its credit ratings infrastructure directly on the Solana mainnet in partnership with AlphaLedger, establishing Solana as the first major public, permissionless blockchain to feature live Moody’s credit ratings in machine-readable form, as reported by Cryptonews. Additionally, SoSoValue data recorded $1.06 million in net inflows into Solana spot ETFs over three consecutive days, according to En Coin Turk, though price action has remained under broader selling pressure.
Momentum indicators confirm bearish trend below resistance levels
On the hourly chart, SOL is trading below the MA-20 at $69.88 and the MA-50 at $71.44, while also remaining well beneath the MA-200 at $98.42. The Ichimoku Kijun level at $70.39 serves as immediate resistance. Momentum indicators show MACD in a strong sell configuration, ADX confirming a bearish environment, RSI at 33.99, and CCI signaling sell. BBP indicates oversold conditions, Stoch RSI reads neutral, and the Awesome Oscillator remains indecisive. Support is identified near $66.54, with resistance at $70.39 and $71.44.
Rangebound outlook as volatility bands define near-term risk
In the short term, Solana is expected to trade within a typical volatility band of $66.54 to $70.78 over the next two to three sessions. The baseline scenario envisions sideways trading within this range. Should resistance at $70.39 be breached, a bullish attempt toward higher levels becomes possible. Conversely, a drop below $66.54 would likely lead to an accelerated decline.
Earlier, analysts noted that Solana was experiencing persistent bearish momentum despite brief rebounds, with technical signals remaining weak. The current environment reinforces this trend, as sustained seller pressure and lack of technical strength suggest that traders should closely monitor the $66.54 support level for signs of further downside risk.


Latest Solana News


-
 Afghanistan
-
 Albania
-
 Algeria
-
 Angola
-
 Argentina
-
 Armenia
-
 Australia
-
 Austria
-
 Azerbaijan
-
 Bahamas
-
 Bahrain
-
 Bangladesh
-
 Belarus
-
 Belgium
-
 Bolivia
-
 Botswana
-
 Brazil
-
 Brunei
-
 Bulgaria
-
 Cambodia
-
 Cameroon
-
 Canada
-
 Chile
Chile
-
 China
China
-
 Colombia
-
 Congo
Congo
-
 Costa Rica
-
 Cote d'Ivoire
-
 Croatia
-
 Cuba
Cuba
-
 Cyprus
-
 Czechia
-
 DR Congo
-
 Denmark
-
 Dominican Republic
-
 Ecuador
-
 Egypt
Egypt
-
 El Salvador
-
 Estonia
-
 Eswatini
-
 Ethiopia
-
 Finland
-
 France
-
 Georgia
-
 Germany
-
 Ghana
Ghana
-
 Greece
-
 Haiti
Haiti
-
 Hong Kong
-
 Hungary
-
 India
India
-
 Indonesia
-
 Iran, Islamic republic
-
 Iraq
Iraq
-
 Ireland
-
 Israel
-
 Italy
Italy
-
 Jamaica
-
 Japan
Japan
-
 Jordan
-
 Kazakhstan
-
 Kenya
Kenya
-
 Korea
Korea
-
 Kuwait
-
 Kyrgyzstan
-
 Laos
Laos
-
 Latvia
-
 Lebanon
-
 Lesotho
-
 Libya
Libya
-
 Lithuania
-
 Luxembourg
-
 Madagascar
-
 Malaysia
-
 Malta
Malta
-
 Mauritius
-
 Mexico
-
 Moldova
-
 Mongolia
-
 Montenegro
-
 Morocco
-
 Mozambique
-
 Myanmar
-
 Namibia
-
 Nepal
Nepal
-
 Netherlands
-
 New Zealand
-
 Nigeria
-
 North Macedonia
-
 Norway
-
 Oman
Oman
-
 Pakistan
-
 Palestine
-
 Panama
-
 Papua New Guinea
-
 Paraguay
-
 Peru
Peru
-
 Philippines
-
 Poland
-
 Portugal
-
 Puerto Rico
-
 Qatar
Qatar
-
 Reunion
-
 Romania
-
 Rwanda
-
 Saudi Arabia
-
 Serbia
-
 Singapore
-
 Slovakia
-
 Slovenia
-
 Somalia
-
 South Africa
-
 Spain
Spain
-
 Sri Lanka
-
 Sweden
-
 Switzerland
-
 Syria
Syria
-
 Taiwan
-
 Tajikistan
-
 Tanzania
-
 Thailand
-
 Trinidad and Tobago
-
 Tunisia
-
 Turkey
-
 UAE
UAE
-
 Uganda
-
 Ukraine
-
 United Kingdom
-
United States
-
 Uruguay
-
 Uzbekistan
-
 Venezuela
-
 Vietnam
-
 Yemen
Yemen
-
 Zambia
-
 Zimbabwe
- Forex
- Crypto
