
Solana price prediction: $64.83 support in focus? SOL down 5.40%

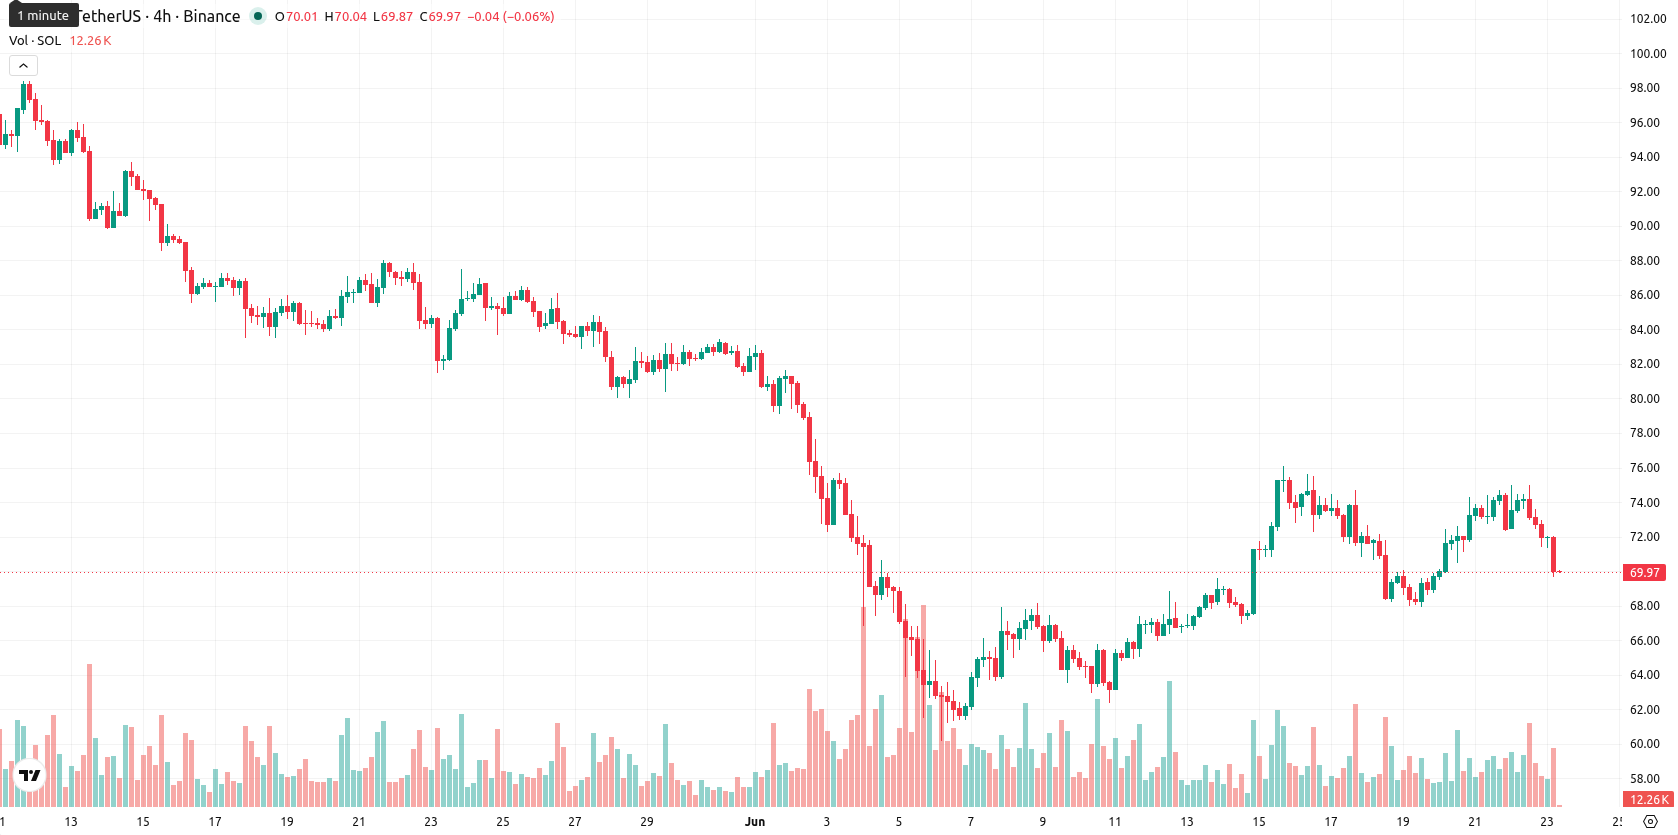
Solana (SOL) is trading at $70.09 after falling 5.4% on the day, with price action positioned below its key moving averages.
Highlights
- Solana faces ongoing U.S. regulatory risk after the SEC labeled SOL a potential unregistered security, deterring institutional investment and ETF inclusion.
- Toss Bank partnered with the Solana Foundation to pilot stablecoin-based cross-border remittances, aligning with new South Korean compliance requirements.
- SOL trades under key moving averages with mixed momentum signals, as volatility increases and price likely ranges between $64.83 and $73.26.
Regulatory barriers and compliance pilots weigh on institutional flows
Solana continues to face a regulatory overhang after the SEC previously labeled SOL as a potential unregistered security, which has restricted institutional participation and ETF eligibility in the United States and introduced ongoing risk around future market access. This development limits the asset’s exposure to broad institutional flows and keeps regulatory clarity as a key binary risk influencing sentiment. Separately, on June 19 Toss Bank signed an agreement with the Solana Foundation to pilot blockchain-based cross-border remittance infrastructure using stablecoins, a move responding to new South Korean regulations and aiming to embed compliance processes, according to Coinpedia.
Diverging momentum signals as SOL stays below resistance
SOL/USD trades below the MA-20 and MA-50 on the 4-hour chart and remains well beneath the MA-200 on the daily chart, pointing toward continuing sell-side pressure across both timeframes. The Ichimoku Kijun level on the daily at $71.46 represents immediate resistance for any attempts at recovery. Support is seen near $64.83, while resistance lies at $73.26. Oscillator readings are conflicted: MACD indicates strong buy, but ADX is neutral, RSI and CCI are both in Sell zones, and Stoch RSI along with BBP signal oversold conditions. The Awesome Oscillator is neutral, and overall signal divergence highlights notable market uncertainty.
Downside risk remains elevated amid tight consolidation range
Over the next two to three trading days, SOL is expected to fluctuate within a volatility band between $64.83 and $73.26. The probability of a downward move remains elevated at 57%, with only a 43% chance of a bullish reversal. The base scenario projects sideways action bounded by the current support and resistance levels. Further downside is plausible if support near $64.83 is breached, while a bullish swing would require a sustained breakout above the Kijun level resistance.
Earlier, analysts noted that Solana continued to attract significant user activity and trading volume even as its DeFi capital remained well below previous highs, reflecting mixed sentiment around its long-term outlook. In the context of recent regulatory headwinds and technical weakness, participants should monitor for a sustained break above daily resistance or a fresh deterioration below support as indicators for Solana's next directional move.


Latest Solana News


-
 Afghanistan
-
 Albania
-
 Algeria
-
 Angola
-
 Argentina
-
 Armenia
-
 Australia
-
 Austria
-
 Azerbaijan
-
 Bahamas
-
 Bahrain
-
 Bangladesh
-
 Belarus
-
 Belgium
-
 Bolivia
-
 Botswana
-
 Brazil
-
 Brunei
-
 Bulgaria
-
 Cambodia
-
 Cameroon
-
 Canada
-
 Chile
Chile
-
 China
China
-
 Colombia
-
 Congo
Congo
-
 Costa Rica
-
 Cote d'Ivoire
-
 Croatia
-
 Cuba
Cuba
-
 Cyprus
-
 Czechia
-
 DR Congo
-
 Denmark
-
 Dominican Republic
-
 Ecuador
-
 Egypt
Egypt
-
 El Salvador
-
 Estonia
-
 Eswatini
-
 Ethiopia
-
 Finland
-
 France
-
 Georgia
-
 Germany
-
 Ghana
Ghana
-
 Greece
-
 Haiti
Haiti
-
 Hong Kong
-
 Hungary
-
 India
India
-
 Indonesia
-
 Iran, Islamic republic
-
 Iraq
Iraq
-
 Ireland
-
 Israel
-
 Italy
Italy
-
 Jamaica
-
 Japan
Japan
-
 Jordan
-
 Kazakhstan
-
 Kenya
Kenya
-
 Korea
Korea
-
 Kuwait
-
 Kyrgyzstan
-
 Laos
Laos
-
 Latvia
-
 Lebanon
-
 Lesotho
-
 Libya
Libya
-
 Lithuania
-
 Luxembourg
-
 Madagascar
-
 Malaysia
-
 Malta
Malta
-
 Mauritius
-
 Mexico
-
 Moldova
-
 Mongolia
-
 Montenegro
-
 Morocco
-
 Mozambique
-
 Myanmar
-
 Namibia
-
 Nepal
Nepal
-
 Netherlands
-
 New Zealand
-
 Nigeria
-
 North Macedonia
-
 Norway
-
 Oman
Oman
-
 Pakistan
-
 Palestine
-
 Panama
-
 Papua New Guinea
-
 Paraguay
-
 Peru
Peru
-
 Philippines
-
 Poland
-
 Portugal
-
 Puerto Rico
-
 Qatar
Qatar
-
 Reunion
-
 Romania
-
 Rwanda
-
 Saudi Arabia
-
 Serbia
-
 Singapore
-
 Slovakia
-
 Slovenia
-
 Somalia
-
 South Africa
-
 Spain
Spain
-
 Sri Lanka
-
 Sweden
-
 Switzerland
-
 Syria
Syria
-
 Taiwan
-
 Tajikistan
-
 Tanzania
-
 Thailand
-
 Trinidad and Tobago
-
 Tunisia
-
 Turkey
-
 UAE
UAE
-
 Uganda
-
 Ukraine
-
 United Kingdom
-
United States
-
 Uruguay
-
 Uzbekistan
-
 Venezuela
-
 Vietnam
-
 Yemen
Yemen
-
 Zambia
-
 Zimbabwe
- Forex
- Crypto
