
Solana price prediction: Can $69.31 support hold as SOL falls 4.34%?

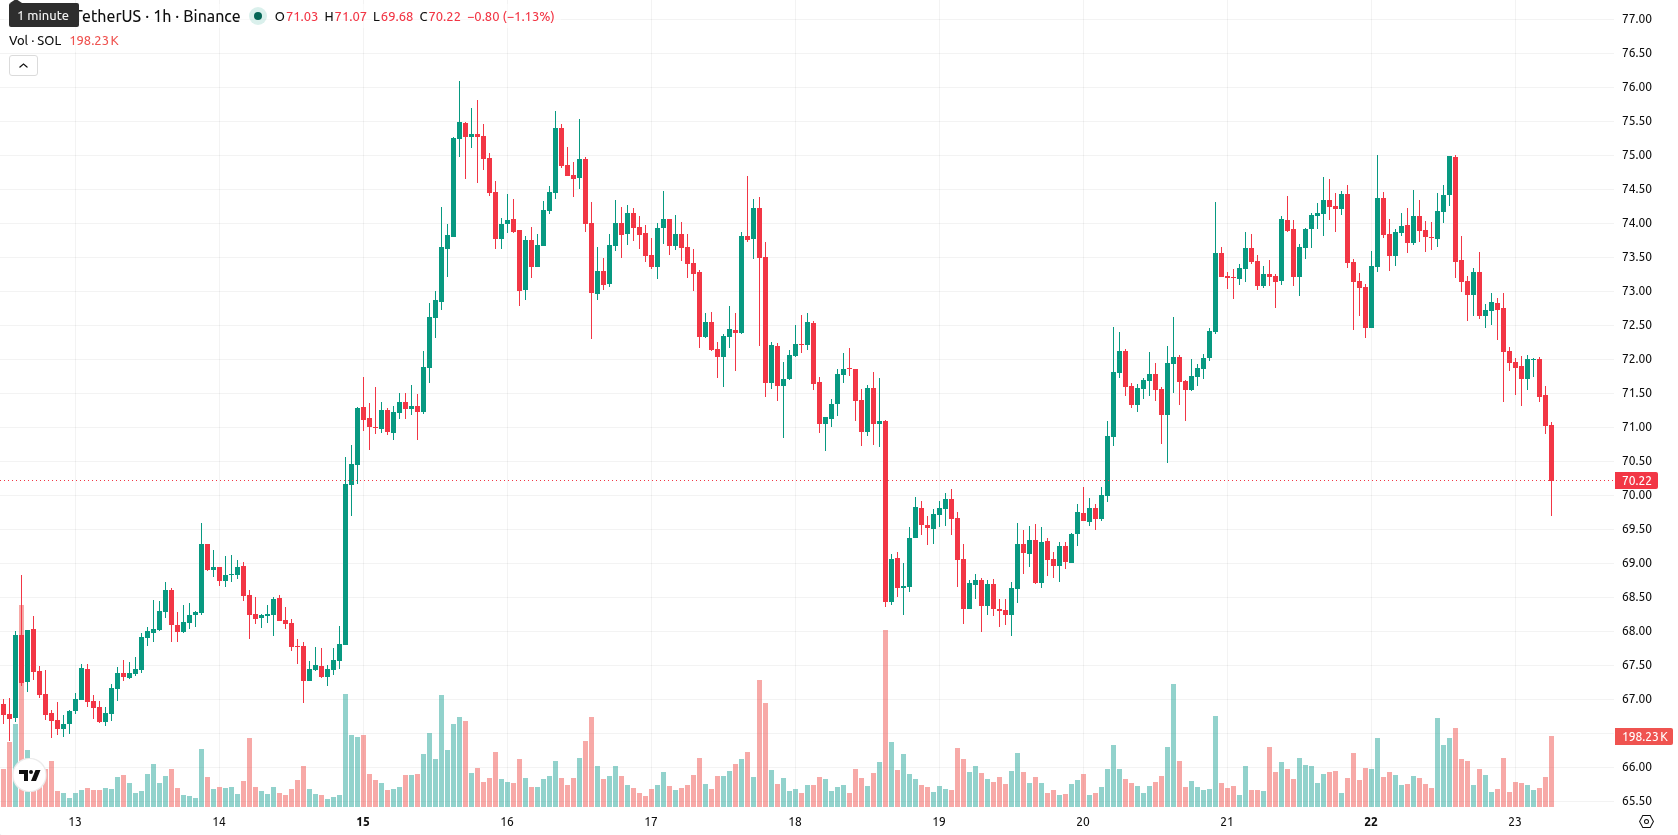
Solana (SOL) is trading at $70.89, down 4.34% on the day. The asset sits below its key moving averages, reflecting prevailing downward momentum.
Highlights
- MoneyGram became an official validator on the Solana blockchain, signaling increased institutional participation and operational credibility for the network.
- Further institutional momentum includes Toss Bank piloting Solana-based stablecoin remittances and Morgan Stanley amending ETF filings to enable a Solana trust with low fees.
- SOL/USD faces sustained bearish pressure, trading below key moving averages, with a likely trading range of $69.31 to $72.47 and a high probability of further downside.
Institutional expansion as corporate participation grows amid price headwinds
MoneyGram became an official validator on the Solana blockchain, staking SOL tokens and actively processing transaction blocks, a development reported by The Block. This move marked the entry of a major payment service provider into Solana's network validation process, raising the profile of enterprise engagement and enhancing operational credibility. Additional institutional initiatives included Toss Bank's memorandum with the Solana Foundation to trial stablecoin-based cross-border remittances and Morgan Stanley's amended ETF filings indicating plans for a Solana trust with low fees, as noted by Tradingview; meanwhile, Beincrypto reported Solana's dominance in tokenized stock trades with over $200 million of single-day volume. These updates highlighted broadening corporate and institutional activity across the ecosystem, though price action has remained under broader selling pressure.
Bearish momentum as technicals confirm oversold conditions near resistance
SOL/USD trades below its MA-20 ($72.76) and MA-50 ($73.32) on the h1 timeframe, and remains well under the long-term MA-200 ($97.12). Immediate resistance is marked at the Ichimoku Kijun level of $73. Momentum signals are firmly bearish, with MACD indicating a Sell bias and ADX remaining Neutral, suggesting trading lacks clear directional conviction. RSI stands at 30.77, while Stoch RSI, CCI, and BBP all indicate oversold or seller-dominated conditions; the Awesome Oscillator is Neutral, showing no additional confirmation of trend. Price is near the session low amid moderate volatility, with no divergence present in any of the key indicators.
Low upside probability as price expected to consolidate within range
In the short term, the projected price range for SOL/USD over the next two to three trading days is $69.31 to $72.47, representing a typical volatility band relative to current levels. The baseline scenario expects consolidation within this corridor. A sustained move above $73 would be necessary to trigger a bullish reversal scenario, while a breakdown below $69.31 could open the door to further downside. Upside probability is considered very low, with downside potential remaining high.
Earlier, analysts noted that Solana's prospects were being buoyed by growing institutional interest and strategic partnerships, though overall market weakness continued to limit upside potential. The latest wave of corporate engagement, particularly MoneyGram's network validation, reinforces this trend, but with Solana trading below key technical levels and momentum signals bearish, traders should be alert to elevated downside risks unless a decisive move above $73 occurs.


Latest Solana News


-
 Afghanistan
-
 Albania
-
 Algeria
-
 Angola
-
 Argentina
-
 Armenia
-
 Australia
-
 Austria
-
 Azerbaijan
-
 Bahamas
-
 Bahrain
-
 Bangladesh
-
 Belarus
-
 Belgium
-
 Bolivia
-
 Botswana
-
 Brazil
-
 Brunei
-
 Bulgaria
-
 Cambodia
-
 Cameroon
-
 Canada
-
 Chile
Chile
-
 China
China
-
 Colombia
-
 Congo
Congo
-
 Costa Rica
-
 Cote d'Ivoire
-
 Croatia
-
 Cuba
Cuba
-
 Cyprus
-
 Czechia
-
 DR Congo
-
 Denmark
-
 Dominican Republic
-
 Ecuador
-
 Egypt
Egypt
-
 El Salvador
-
 Estonia
-
 Eswatini
-
 Ethiopia
-
 Finland
-
 France
-
 Georgia
-
 Germany
-
 Ghana
Ghana
-
 Greece
-
 Haiti
Haiti
-
 Hong Kong
-
 Hungary
-
 India
India
-
 Indonesia
-
 Iran, Islamic republic
-
 Iraq
Iraq
-
 Ireland
-
 Israel
-
 Italy
Italy
-
 Jamaica
-
 Japan
Japan
-
 Jordan
-
 Kazakhstan
-
 Kenya
Kenya
-
 Korea
Korea
-
 Kuwait
-
 Kyrgyzstan
-
 Laos
Laos
-
 Latvia
-
 Lebanon
-
 Lesotho
-
 Libya
Libya
-
 Lithuania
-
 Luxembourg
-
 Madagascar
-
 Malaysia
-
 Malta
Malta
-
 Mauritius
-
 Mexico
-
 Moldova
-
 Mongolia
-
 Montenegro
-
 Morocco
-
 Mozambique
-
 Myanmar
-
 Namibia
-
 Nepal
Nepal
-
 Netherlands
-
 New Zealand
-
 Nigeria
-
 North Macedonia
-
 Norway
-
 Oman
Oman
-
 Pakistan
-
 Palestine
-
 Panama
-
 Papua New Guinea
-
 Paraguay
-
 Peru
Peru
-
 Philippines
-
 Poland
-
 Portugal
-
 Puerto Rico
-
 Qatar
Qatar
-
 Reunion
-
 Romania
-
 Rwanda
-
 Saudi Arabia
-
 Serbia
-
 Singapore
-
 Slovakia
-
 Slovenia
-
 Somalia
-
 South Africa
-
 Spain
Spain
-
 Sri Lanka
-
 Sweden
-
 Switzerland
-
 Syria
Syria
-
 Taiwan
-
 Tajikistan
-
 Tanzania
-
 Thailand
-
 Trinidad and Tobago
-
 Tunisia
-
 Turkey
-
 UAE
UAE
-
 Uganda
-
 Ukraine
-
 United Kingdom
-
United States
-
 Uruguay
-
 Uzbekistan
-
 Venezuela
-
 Vietnam
-
 Yemen
Yemen
-
 Zambia
-
 Zimbabwe
- Forex
- Crypto
