
Ethereum trades down as US spot Ethereum ETF outflows reach 910M dollars since May

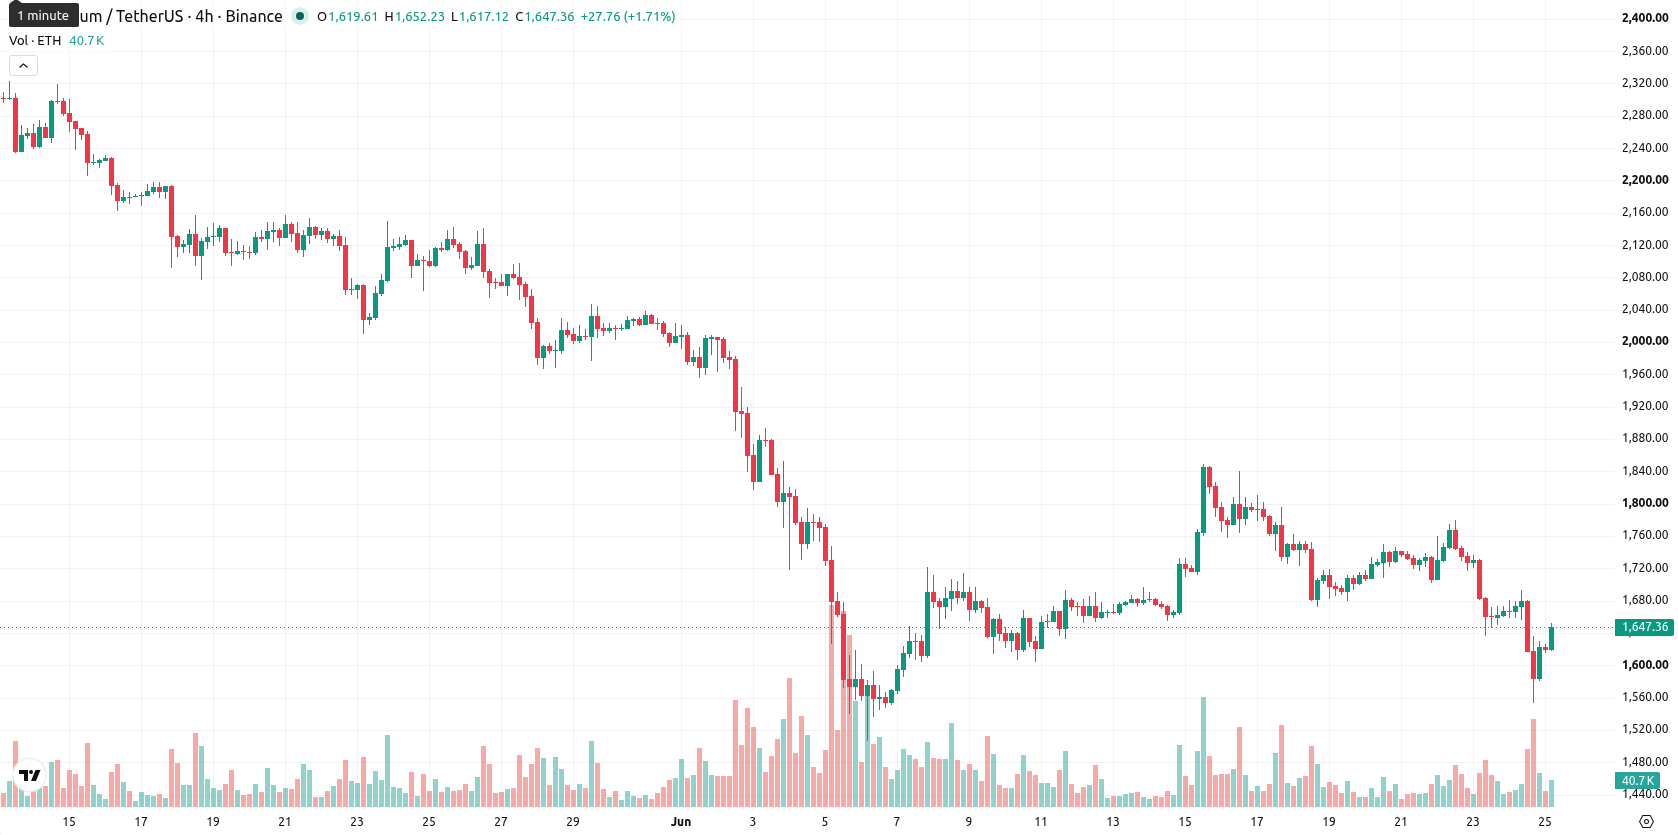
Ethereum (ETH) is trading at $1,646.81, down 1.52% on the day. The price sits below its key moving averages, signaling continued short-term and long-term downward pressure.
Highlights
- US-listed spot Ethereum ETFs saw net outflows for the sixth consecutive week, totaling $910 million since mid-May.
- Sustained capital flight and diminishing demand reflect institutional risk aversion amid geopolitical uncertainty and a hawkish Fed stance.
- ETH/USD faces persistent selling pressure, trades below major technical levels, with a high probability of moving toward the $1,545–$1,748 range.
Institutional outflows intensify as macro risks curb demand
US-listed spot Ethereum ETFs registered net outflows for a sixth consecutive week, with $910 million withdrawn since mid-May, reflecting ongoing institutional capital flight from the asset, according to CryptoNews. These outflows indicate declining liquidity and sustained demand reduction among large investors. The backdrop is heightened by geopolitical tensions and risk aversion, alongside a more hawkish Federal Reserve policy stance, which has made Ethereum and similar assets relatively less attractive in the current environment.
Sustained selling pressure as technical signals stay bearish
On the technical side, ETH/USD remains below the 20-period ($1,684) and 50-period ($1,713) moving averages on the H4 chart, and trades far beneath the 200-period moving average ($2,344) on the daily timeframe. The Ichimoku Kijun on the daily sits at $1,666 as immediate resistance. The Moving Average Convergence Divergence (MACD) signals sell, while the Average Directional Index (ADX) indicates trend strength is neutral on the H4 chart. The Relative Strength Index (RSI) reads 35.63, favoring sellers, while the Commodity Channel Index (CCI) shows overbought at higher intervals but flags an oversold situation intraday, similar to the Bull/Bear Power indicator. Both Stochastic RSI and ADX are also neutral, with the Awesome Oscillator supporting continued downward pressure. Intraday volatility is moderate, and trading is near today’s high, as sellers retain control though some oscillators indicate mild divergence with price near session lows.
Downside outlook prevails barring break above key resistance
Looking ahead, the expected price range for Ethereum over the coming days is $1,545 to $1,748, a typical volatility band relative to current levels. The probability of an upward move is considered very low, while a downward move holds a very high probability under prevailing conditions. If the price stabilizes, consolidation within this range is possible; however, a break above $1,666 (the Ichimoku Kijun level) could trigger upside momentum, whereas a move below $1,545 would reinforce the prevailing selling trend.
Previously it was reported that Ethereum faced sustained downside pressure amid institutional restructuring and waning investor confidence. The current article reinforces this outlook with continued institutional outflows and technical weakness, highlighting that a break below $1,545 would significantly amplify downside risk in the coming days.


Latest Ethereum News


-
 Afghanistan
-
 Albania
-
 Algeria
-
 Angola
-
 Argentina
-
 Armenia
-
 Australia
-
 Austria
-
 Azerbaijan
-
 Bahamas
-
 Bahrain
-
 Bangladesh
-
 Belarus
-
 Belgium
-
 Bolivia
-
 Botswana
-
 Brazil
-
 Brunei
-
 Bulgaria
-
 Cambodia
-
 Cameroon
-
 Canada
-
 Chile
Chile
-
 China
China
-
 Colombia
-
 Congo
Congo
-
 Costa Rica
-
 Cote d'Ivoire
-
 Croatia
-
 Cuba
Cuba
-
 Cyprus
-
 Czechia
-
 DR Congo
-
 Denmark
-
 Dominican Republic
-
 Ecuador
-
 Egypt
Egypt
-
 El Salvador
-
 Estonia
-
 Eswatini
-
 Ethiopia
-
 Finland
-
 France
-
 Georgia
-
 Germany
-
 Ghana
Ghana
-
 Greece
-
 Haiti
Haiti
-
 Hong Kong
-
 Hungary
-
 India
India
-
 Indonesia
-
 Iran, Islamic republic
-
 Iraq
Iraq
-
 Ireland
-
 Israel
-
 Italy
Italy
-
 Jamaica
-
 Japan
Japan
-
 Jordan
-
 Kazakhstan
-
 Kenya
Kenya
-
 Korea
Korea
-
 Kuwait
-
 Kyrgyzstan
-
 Laos
Laos
-
 Latvia
-
 Lebanon
-
 Lesotho
-
 Libya
Libya
-
 Lithuania
-
 Luxembourg
-
 Madagascar
-
 Malaysia
-
 Malta
Malta
-
 Mauritius
-
 Mexico
-
 Moldova
-
 Mongolia
-
 Montenegro
-
 Morocco
-
 Mozambique
-
 Myanmar
-
 Namibia
-
 Nepal
Nepal
-
 Netherlands
-
 New Zealand
-
 Nigeria
-
 North Macedonia
-
 Norway
-
 Oman
Oman
-
 Pakistan
-
 Palestine
-
 Panama
-
 Papua New Guinea
-
 Paraguay
-
 Peru
Peru
-
 Philippines
-
 Poland
-
 Portugal
-
 Puerto Rico
-
 Qatar
Qatar
-
 Reunion
-
 Romania
-
 Rwanda
-
 Saudi Arabia
-
 Serbia
-
 Singapore
-
 Slovakia
-
 Slovenia
-
 Somalia
-
 South Africa
-
 Spain
Spain
-
 Sri Lanka
-
 Sweden
-
 Switzerland
-
 Syria
Syria
-
 Taiwan
-
 Tajikistan
-
 Tanzania
-
 Thailand
-
 Trinidad and Tobago
-
 Tunisia
-
 Turkey
-
 UAE
UAE
-
 Uganda
-
 Ukraine
-
 United Kingdom
-
United States
-
 Uruguay
-
 Uzbekistan
-
 Venezuela
-
 Vietnam
-
 Yemen
Yemen
-
 Zambia
-
 Zimbabwe
- Forex
- Crypto
