
Long-term resistance caps Movement upside despite positive momentum

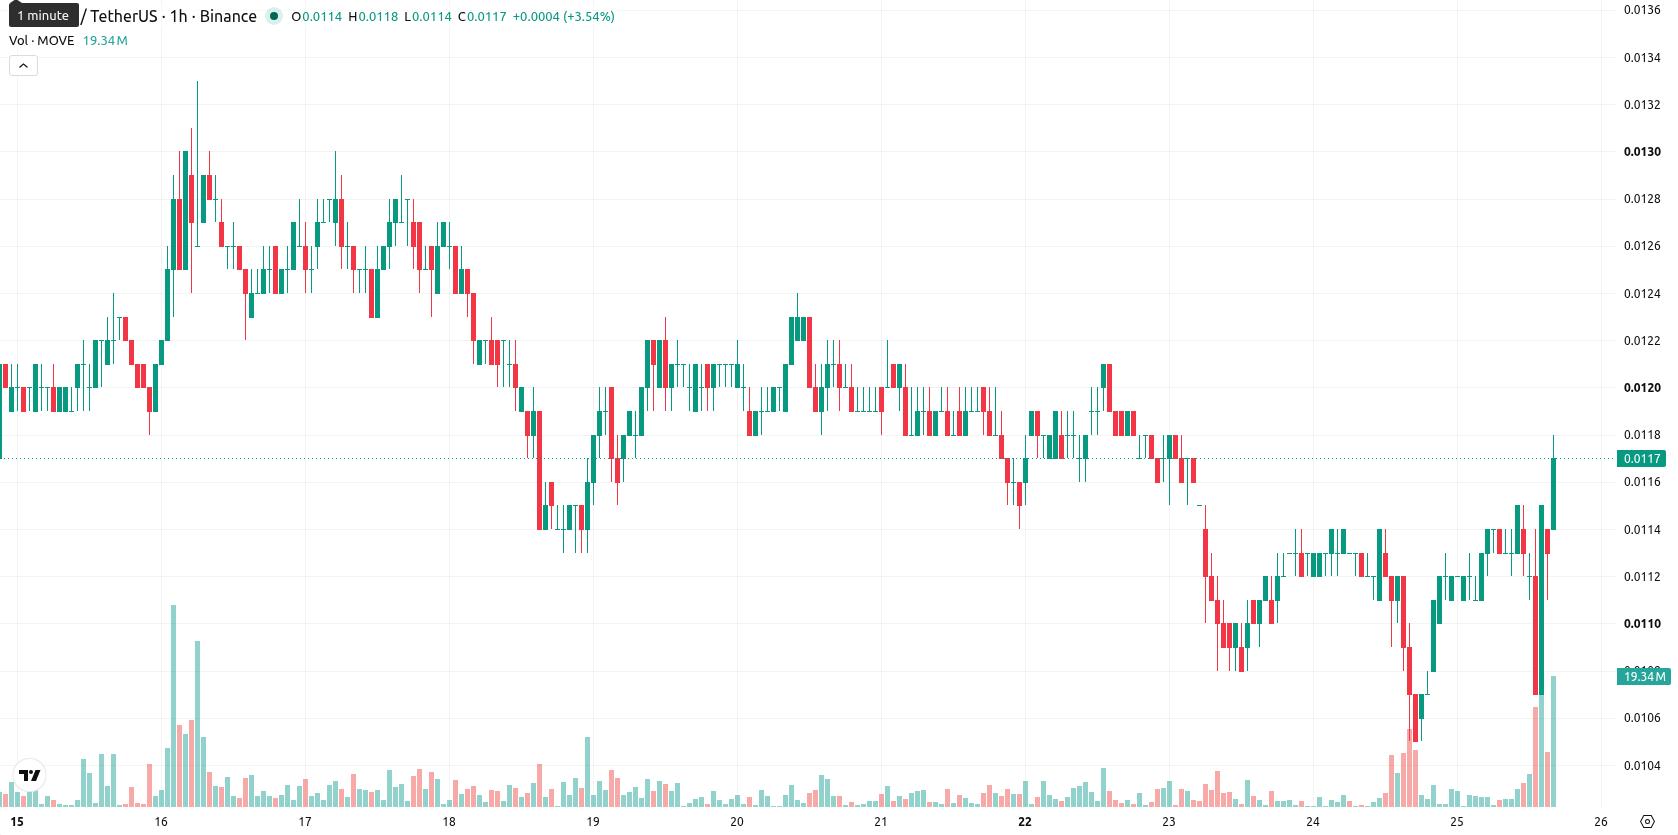
Movement (MOVE) is trading at $0.0116, up 9.43% on the day. The price is positioned above its key short- and medium-term moving averages, reflecting strength over recent sessions.
 0.01
0.0110
0.01
0.0110
Highlights
- MOVE/USD trades with short- and medium-term bullish momentum but faces longer-term selling pressure below key resistance.
- Technical indicators show strong buy signals from MACD and buyer dominance, but mixed momentum and trend signals suggest caution.
- Expected intraday range is $0.0111 to $0.012 with a 61% probability of upward movement, immediate support at $0.011.
Bullish bias faces resistance as momentum signals diverge
On the technical front, MOVE has established itself above the MA-20 and MA-50, while remaining below the MA-200, highlighting short- and medium-term bullishness with persistent long-term resistance. The Ichimoku Kijun provides immediate support at $0.011. The Moving Average Convergence Divergence (MACD) indicates strong buy momentum, but the Average Directional Index (ADX) remains neutral, signaling a lack of clear trend strength. The Relative Strength Index (RSI) stands at 49.79 with a Sell indication, while both the Stochastic RSI and Commodity Channel Index (CCI) are neutral, suggesting there are no overbought or oversold signals. Bull/Bear Power points to ongoing buyer dominance, with intraday sentiment described as bullish amid high volatility and price holding near the session high. Divergence among momentum and oscillator signals tempers strong enthusiasm seen in price action.
Directional risk shifts with volatility in projected range
Looking ahead to the next trading day, MOVE is expected to fluctuate within a price range of $0.0111 to $0.012, reflecting typical volatility relative to current levels. The probability model suggests a 61% chance of an upward move versus 39% for a decline. The baseline scenario envisions continued movement within this established corridor; a break above resistance would confirm a bullish case, while a drop below immediate support would set up a bearish scenario.
Earlier, analysts noted that sellers had established firm control over Movement (MOVE), reinforcing a bearish outlook amid persistent downside momentum. Recent bullish price action above key short- and medium-term averages now signals a shift toward renewed buyer interest, with the next trading session likely hinging on whether MOVE can decisively break above current resistance or falls back below immediate support levels.








-
 Afghanistan
-
 Albania
-
 Algeria
-
 Angola
-
 Argentina
-
 Armenia
-
 Australia
-
 Austria
-
 Azerbaijan
-
 Bahamas
-
 Bahrain
-
 Bangladesh
-
 Belarus
-
 Belgium
-
 Bolivia
-
 Botswana
-
 Brazil
-
 Brunei
-
 Bulgaria
-
 Cambodia
-
 Cameroon
-
 Canada
-
 Chile
Chile
-
 China
China
-
 Colombia
-
 Congo
Congo
-
 Costa Rica
-
 Cote d'Ivoire
-
 Croatia
-
 Cuba
Cuba
-
 Cyprus
-
 Czechia
-
 DR Congo
-
 Denmark
-
 Dominican Republic
-
 Ecuador
-
 Egypt
Egypt
-
 El Salvador
-
 Estonia
-
 Eswatini
-
 Ethiopia
-
 Finland
-
 France
-
 Georgia
-
 Germany
-
 Ghana
Ghana
-
 Greece
-
 Haiti
Haiti
-
 Hong Kong
-
 Hungary
-
 India
India
-
 Indonesia
-
 Iran, Islamic republic
-
 Iraq
Iraq
-
 Ireland
-
 Israel
-
 Italy
Italy
-
 Jamaica
-
 Japan
Japan
-
 Jordan
-
 Kazakhstan
-
 Kenya
Kenya
-
 Korea
Korea
-
 Kuwait
-
 Kyrgyzstan
-
 Laos
Laos
-
 Latvia
-
 Lebanon
-
 Lesotho
-
 Libya
Libya
-
 Lithuania
-
 Luxembourg
-
 Madagascar
-
 Malaysia
-
 Malta
Malta
-
 Mauritius
-
 Mexico
-
 Moldova
-
 Mongolia
-
 Montenegro
-
 Morocco
-
 Mozambique
-
 Myanmar
-
 Namibia
-
 Nepal
Nepal
-
 Netherlands
-
 New Zealand
-
 Nigeria
-
 North Macedonia
-
 Norway
-
 Oman
Oman
-
 Pakistan
-
 Palestine
-
 Panama
-
 Papua New Guinea
-
 Paraguay
-
 Peru
Peru
-
 Philippines
-
 Poland
-
 Portugal
-
 Puerto Rico
-
 Qatar
Qatar
-
 Reunion
-
 Romania
-
 Rwanda
-
 Saudi Arabia
-
 Serbia
-
 Singapore
-
 Slovakia
-
 Slovenia
-
 Somalia
-
 South Africa
-
 Spain
Spain
-
 Sri Lanka
-
 Sweden
-
 Switzerland
-
 Syria
Syria
-
 Taiwan
-
 Tajikistan
-
 Tanzania
-
 Thailand
-
 Trinidad and Tobago
-
 Tunisia
-
 Turkey
-
 UAE
UAE
-
 Uganda
-
 Ukraine
-
 United Kingdom
-
United States
-
 Uruguay
-
 Uzbekistan
-
 Venezuela
-
 Vietnam
-
 Yemen
Yemen
-
 Zambia
-
 Zimbabwe
- Forex
- Crypto












