
ETH consolidates as price remains below MA-20 resistance at $2,008: weekly forecast

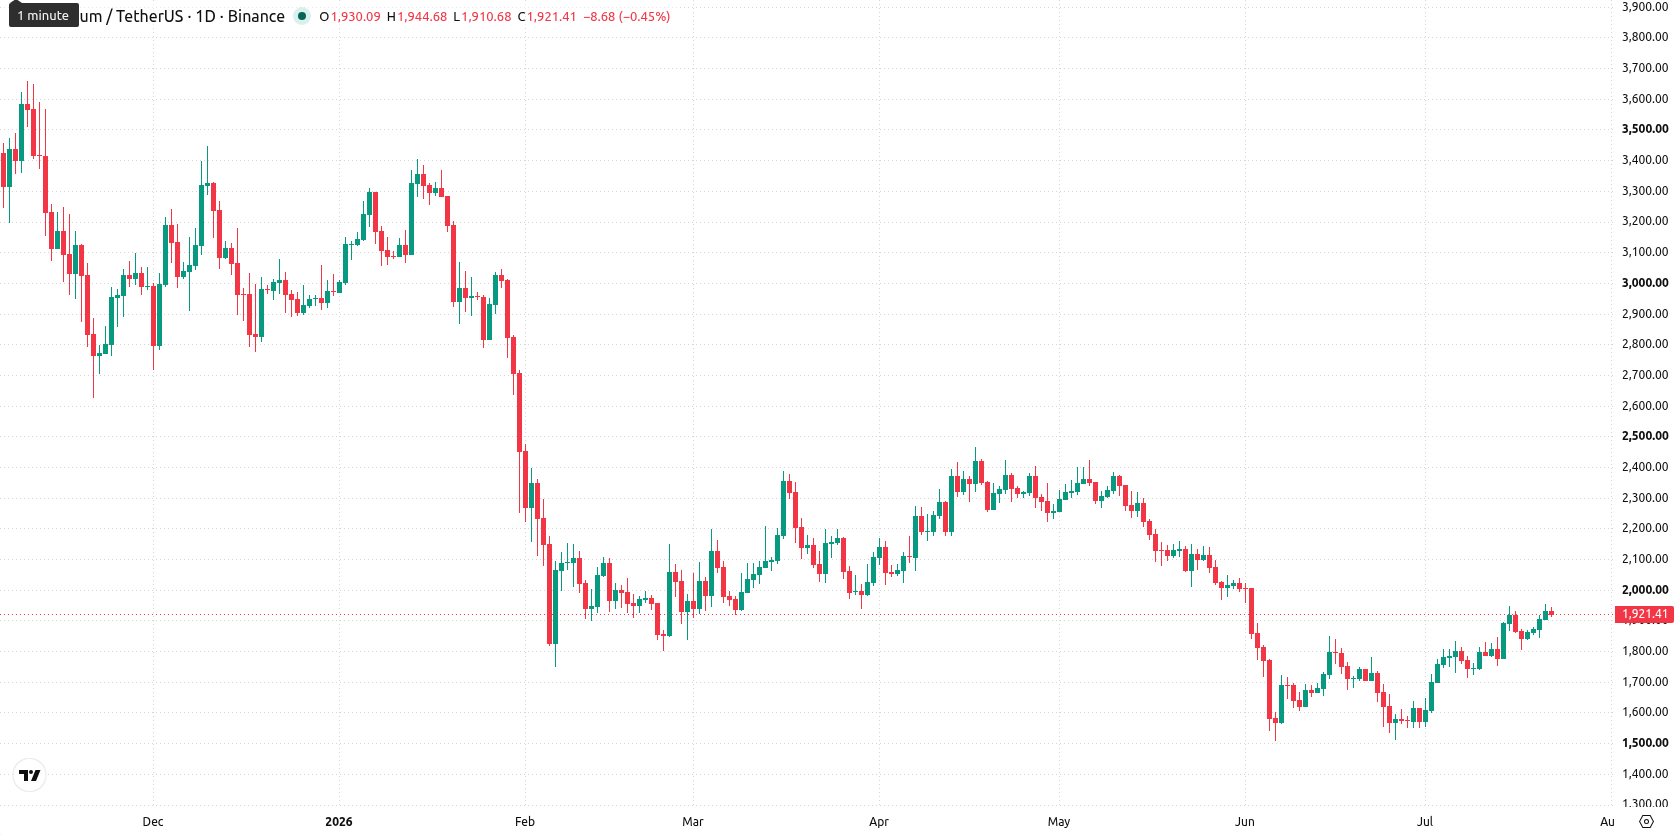
Ethereum (ETH) is trading at $1,921.47, marking a weekly increase of $45.40 or 2.48%. The price remains below its weekly MA-20 ($2,008.13), MA-50 ($2,821.95), and MA-200 ($2,478.51), reflecting ongoing medium- and long-term downward pressure and positioning the asset in the upper segment of the recent weekly range.
 1981.24
1967.36
1981.24
1967.36
Highlights
- Ethereum trades under key moving averages, reflecting sustained bearish momentum and ongoing seller dominance in the medium to long term.
- All primary weekly technical indicators signal weakness, with the MACD and RSI suggesting further downside and very low probability of gains.
- Ethereum is expected to remain in a $1,765–$2,080 range over the coming week, with a sideways or downward bias prevailing.
Institutional inflows and product innovation drive week’s bullish sentiment
U.S. spot Ethereum exchange-traded funds (ETFs), including offerings from BlackRock and Fidelity, have achieved consecutive days of net inflows and now hold over $10 billion in assets, underscoring surging institutional demand for ETH. Large investors have increased their Ethereum accumulation and staking activity, with major corporate treasuries also reported to hold significant reserves. Robinhood introduced Robinhood Chain, an Ethereum Layer 2 built on Arbitrum, aimed at broadening DeFi accessibility. Regulatory clarity in the U.S. is improving, supporting new product innovation and further institutional participation in the Ethereum ecosystem.
Bearish signals persist despite price recovery as technicals diverge
On the weekly timeframe, Ethereum trades below all major moving averages (MA-20, MA-50, and MA-200), with dynamic resistance posed by the nearest MA levels and the Ichimoku Kijun line. Support sits near $1,765, while resistance is at $2,080. RSI on the weekly chart issues a sell signal and the MACD continues to trend bearish, while the ADX suggests weak momentum. Both the Stochastic RSI and Bull/Bear Power indicators point to overbought conditions, highlighting divergence between price recovery and underlying momentum.
Sideways consolidation expected as momentum shows risk of renewed downside
For the next seven days, Ethereum is likely to move sideways between $1,765 and $2,080, reflecting ongoing volatility and mixed technical signals on the weekly chart. The baseline scenario favors consolidation within this range, as all key indicators (RSI, ADX, MACD, CCI) remain neutral or bearish. A close above $2,080 would require a significant shift in momentum, while a decline below $1,765 could materialize if selling intensifies. The probability of further gains in the upcoming week is low, with a stronger risk of renewed downside.
Earlier, analysts noted that Ethereum’s recovery was constrained by limited buying volume despite support from institutional inflows and large holders. The current consolidation beneath major moving averages, alongside persistent sell signals from multiple indicators, suggests traders should closely monitor whether Ethereum can maintain support above $1,765 amid ongoing volatility.


Latest Ethereum News







-
 Afghanistan
-
 Albania
-
 Algeria
-
 Angola
-
 Argentina
-
 Armenia
-
 Australia
-
 Austria
-
 Azerbaijan
-
 Bahamas
-
 Bahrain
-
 Bangladesh
-
 Belarus
-
 Belgium
-
 Bolivia
-
 Botswana
-
 Brazil
-
 Brunei
-
 Bulgaria
-
 Cambodia
-
 Cameroon
-
 Canada
-
 Chile
Chile
-
 China
China
-
 Colombia
-
 Congo
Congo
-
 Costa Rica
-
 Cote d'Ivoire
-
 Croatia
-
 Cuba
Cuba
-
 Cyprus
-
 Czechia
-
 DR Congo
-
 Denmark
-
 Dominican Republic
-
 Ecuador
-
 Egypt
Egypt
-
 El Salvador
-
 Estonia
-
 Eswatini
-
 Ethiopia
-
 Finland
-
 France
-
 Georgia
-
 Germany
-
 Ghana
Ghana
-
 Greece
-
 Haiti
Haiti
-
 Hong Kong
-
 Hungary
-
 India
India
-
 Indonesia
-
 Iran, Islamic republic
-
 Iraq
Iraq
-
 Ireland
-
 Israel
-
 Italy
Italy
-
 Jamaica
-
 Japan
Japan
-
 Jordan
-
 Kazakhstan
-
 Kenya
Kenya
-
 Korea
Korea
-
 Kuwait
-
 Kyrgyzstan
-
 Laos
Laos
-
 Latvia
-
 Lebanon
-
 Lesotho
-
 Libya
Libya
-
 Lithuania
-
 Luxembourg
-
 Madagascar
-
 Malaysia
-
 Malta
Malta
-
 Mauritius
-
 Mexico
-
 Moldova
-
 Mongolia
-
 Montenegro
-
 Morocco
-
 Mozambique
-
 Myanmar
-
 Namibia
-
 Nepal
Nepal
-
 Netherlands
-
 New Zealand
-
 Nigeria
-
 North Macedonia
-
 Norway
-
 Oman
Oman
-
 Pakistan
-
 Palestine
-
 Panama
-
 Papua New Guinea
-
 Paraguay
-
 Peru
Peru
-
 Philippines
-
 Poland
-
 Portugal
-
 Puerto Rico
-
 Qatar
Qatar
-
 Reunion
-
 Romania
-
 Rwanda
-
 Saudi Arabia
-
 Serbia
-
 Singapore
-
 Slovakia
-
 Slovenia
-
 Somalia
-
 South Africa
-
 Spain
Spain
-
 Sri Lanka
-
 Sweden
-
 Switzerland
-
 Syria
Syria
-
 Taiwan
-
 Tajikistan
-
 Tanzania
-
 Thailand
-
 Trinidad and Tobago
-
 Tunisia
-
 Turkey
-
 UAE
UAE
-
 Uganda
-
 Ukraine
-
 United Kingdom
-
United States
-
 Uruguay
-
 Uzbekistan
-
 Venezuela
-
 Vietnam
-
 Yemen
Yemen
-
 Zambia
-
 Zimbabwe
- Forex
- Crypto












