

Solana (SOL) is trading nearly unchanged at $77.53, with a slight intraday move and moderate volatility. The asset is currently positioned below its key moving averages across short, medium, and long-term timeframes.
 77.5
78.88
77.5
78.88
Highlights
- Morgan Stanley filed final SEC paperwork for Solana and Ethereum staking ETFs, signaling potential institutional access to staking rewards.
- Solana spot ETFs recorded $5.83 million in net inflows, the strongest daily institutional demand since early July, highlighting sustained interest.
- SOL/USD trades below key averages amid technical weakness; predicted 2–3 day price range is $75.61 to $78.76 with 61% odds of further decline.
Institutional flows rise as ETF filings and staking rewards reshape access
Morgan Stanley has filed final paperwork with the SEC for Solana and Ethereum staking ETFs on NYSE Arca, a regulatory step that may facilitate broader access for institutional investors to direct staking rewards, according to Cryptobriefing. Supporting this context, Solana spot ETFs saw $5.83 million in net inflows on Tuesday, the strongest single-day institutional uptake since July 6, as reported by Cryptonews, suggesting ongoing appetite for regulated Solana vehicles. Grayscale also submitted a new Form 8-K for its Solana Staking ETF, proposing quarterly distribution of staking rewards to shareholders, as noted by Cryptbull, further illustrating evolving product structures in the market. In addition, 67% of Solana block production was concentrated in Europe on Wednesday, based on Glassnode data shared by Tronweekly, providing insight on validator activity.
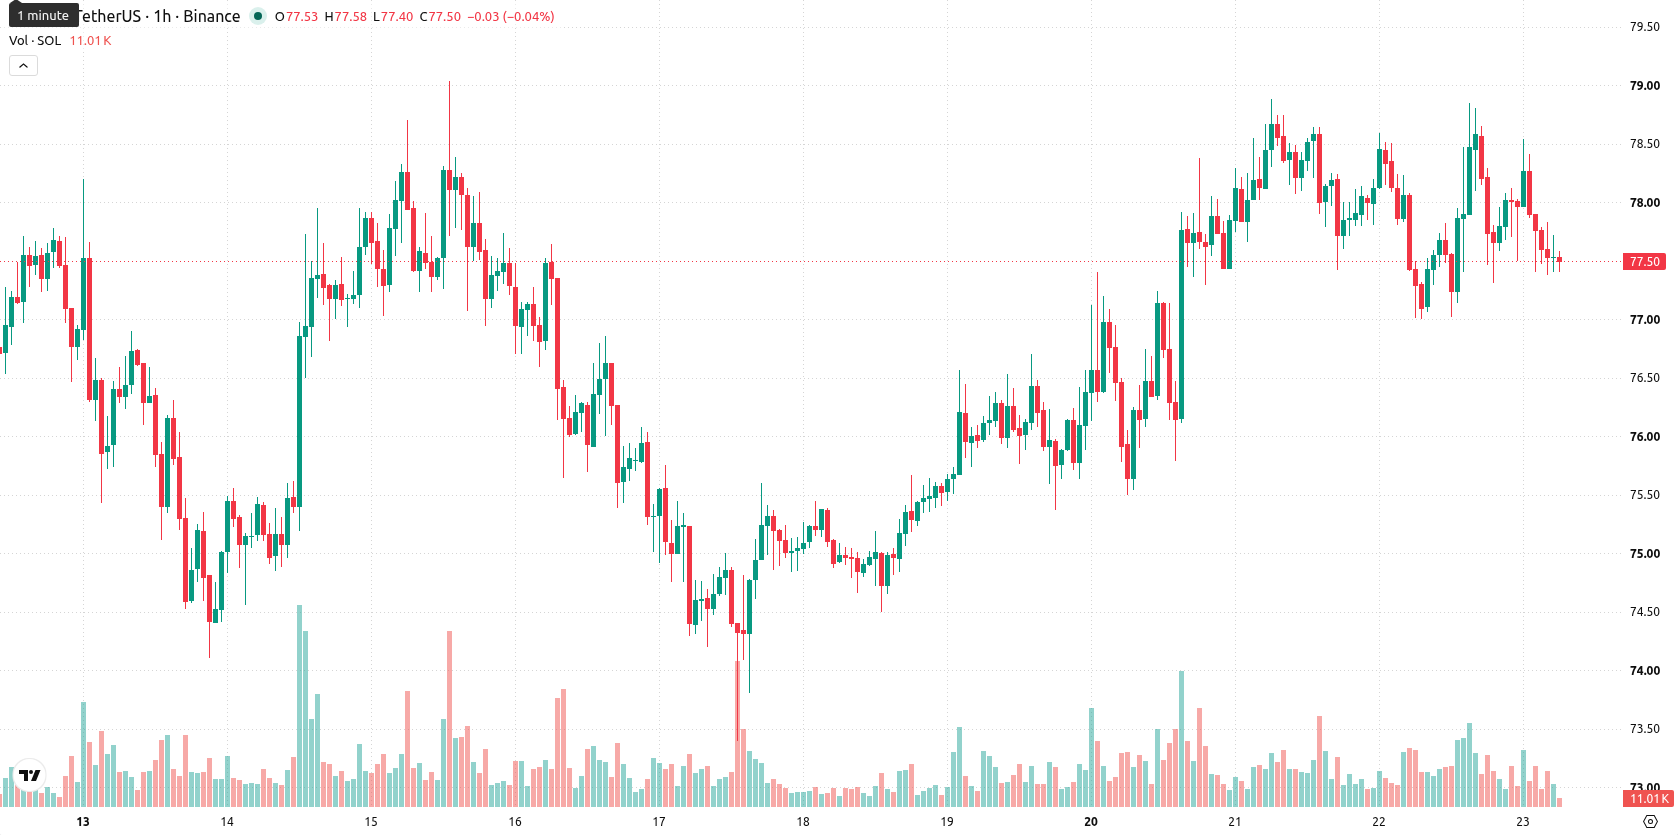
Downside momentum builds as Solana tests resistance and oscillators signal weakness
SOL/USD is situated below the MA-20 at $77.87, MA-50 at $78, and MA-200 at $89.33. The Ichimoku Kijun at $77.93 presents immediate resistance. On the momentum front, MACD and ADX are neutral, while both RSI and CCI indicate selling pressure. Stochastic RSI is in oversold territory, highlighting short-term downside exhaustion. Bull/Bear Power points to seller dominance intraday, and the Awesome Oscillator does not confirm a clear directional trend.
Downside risk persists as consolidation range remains dominant
For the next 2–3 trading days, typical volatility is expected to keep the price within a $75.61 to $78.76 corridor. There is a 39% probability of an upward breakout, while a downward move is more likely at 61%. The baseline outlook is for SOL to consolidate within this range, with a close above $77.93 providing a potential trigger for a bullish move; a drop below $75.61 would shift the risk toward accelerated declines.
Earlier, analysts noted that Solana’s expanding ecosystem and institutional interest were building a foundation for potential upward momentum, though price action remained constrained by broader market pressures. The latest surge in ETF filings and institutional inflows adds a new dimension to this outlook, making the forthcoming battle over the $77.93 resistance level a key pivot for traders watching for a reversal or further downside extension.


Latest Solana News







-
 Afghanistan
-
 Albania
-
 Algeria
-
 Angola
-
 Argentina
-
 Armenia
-
 Australia
-
 Austria
-
 Azerbaijan
-
 Bahamas
-
 Bahrain
-
 Bangladesh
-
 Belarus
-
 Belgium
-
 Bolivia
-
 Botswana
-
 Brazil
-
 Brunei
-
 Bulgaria
-
 Cambodia
-
 Cameroon
-
 Canada
-
 Chile
Chile
-
 China
China
-
 Colombia
-
 Congo
Congo
-
 Costa Rica
-
 Cote d'Ivoire
-
 Croatia
-
 Cuba
Cuba
-
 Cyprus
-
 Czechia
-
 DR Congo
-
 Denmark
-
 Dominican Republic
-
 Ecuador
-
 Egypt
Egypt
-
 El Salvador
-
 Estonia
-
 Eswatini
-
 Ethiopia
-
 Finland
-
 France
-
 Georgia
-
 Germany
-
 Ghana
Ghana
-
 Greece
-
 Haiti
Haiti
-
 Hong Kong
-
 Hungary
-
 India
India
-
 Indonesia
-
 Iran, Islamic republic
-
 Iraq
Iraq
-
 Ireland
-
 Israel
-
 Italy
Italy
-
 Jamaica
-
 Japan
Japan
-
 Jordan
-
 Kazakhstan
-
 Kenya
Kenya
-
 Korea
Korea
-
 Kuwait
-
 Kyrgyzstan
-
 Laos
Laos
-
 Latvia
-
 Lebanon
-
 Lesotho
-
 Libya
Libya
-
 Lithuania
-
 Luxembourg
-
 Madagascar
-
 Malaysia
-
 Malta
Malta
-
 Mauritius
-
 Mexico
-
 Moldova
-
 Mongolia
-
 Montenegro
-
 Morocco
-
 Mozambique
-
 Myanmar
-
 Namibia
-
 Nepal
Nepal
-
 Netherlands
-
 New Zealand
-
 Nigeria
-
 North Macedonia
-
 Norway
-
 Oman
Oman
-
 Pakistan
-
 Palestine
-
 Panama
-
 Papua New Guinea
-
 Paraguay
-
 Peru
Peru
-
 Philippines
-
 Poland
-
 Portugal
-
 Puerto Rico
-
 Qatar
Qatar
-
 Reunion
-
 Romania
-
 Rwanda
-
 Saudi Arabia
-
 Serbia
-
 Singapore
-
 Slovakia
-
 Slovenia
-
 Somalia
-
 South Africa
-
 Spain
Spain
-
 Sri Lanka
-
 Sweden
-
 Switzerland
-
 Syria
Syria
-
 Taiwan
-
 Tajikistan
-
 Tanzania
-
 Thailand
-
 Trinidad and Tobago
-
 Tunisia
-
 Turkey
-
 UAE
UAE
-
 Uganda
-
 Ukraine
-
 United Kingdom
-
United States
-
 Uruguay
-
 Uzbekistan
-
 Venezuela
-
 Vietnam
-
 Yemen
Yemen
-
 Zambia
-
 Zimbabwe
- Forex
- Crypto












